
DISCOUNTED EDUCATION PRICING! CALL 1-877-891-8411. We Gladly Accept School Purchase Orders!

In today’s fast-paced, information-rich world, the ability to communicate complex ideas quickly and effectively is more important than ever. For educators, especially those teaching STEM (Science, Technology, Engineering, and Mathematics) subjects or working in HeadStart programs, infographics are a game-changing tool. They can turn abstract concepts into visually engaging, easy-to-understand learning experiences.
Welcome to Infographics 101, your ultimate guide to mastering the art of visual communication in education. Whether you’re a teacher looking to boost student engagement or a STEM enthusiast eager to share data-driven insights, this blog will equip you with everything you need to know about creating and using infographics effectively.
Infographics are visual representations of information, data, or knowledge designed to present complex information quickly and clearly1. But why are they so crucial in STEM education?
HeadStart programs aim to give young learners a jump-start in their educational journey. Infographics can play a crucial role in this process by:
To create impactful STEM infographics, consider including these essential components:
Follow these steps to craft an engaging STEM infographic:
Several user-friendly tools are available for creating stunning STEM infographics:
Integrate infographics into your STEM lessons by:
To create impactful STEM infographics:
Infographics in STEM education can:
By mastering the art of infographic creation, you’ll not only enhance your STEM teaching but also equip your students with valuable visual communication skills. Remember, a well-designed infographic can turn complex STEM concepts into engaging visual stories that captivate and educate.
Are you ready to transform your STEM classroom with the power of infographics? Start creating and watch your students’ engagement and under
STEM subjects often involve abstract concepts, intricate processes, and large datasets that can be challenging for students to grasp through text alone. This is where infographics shine.
STEM topics like coding algorithms, chemical reactions, or physics equations can feel intimidating at first glance. Infographics break these concepts down into bite-sized pieces using visuals that make them easier to digest.
Studies show that people remember 80% of what they see, compared to just 20% of what they read. By presenting STEM content visually, infographics help students retain information longer and recall it more easily during exams or practical applications.
Let’s face it: not every student is naturally excited about STEM subjects. A well-designed infographic with vibrant visuals and relatable examples can capture their attention and spark curiosity in ways a textbook never could.
In today’s data-driven world, understanding how to interpret graphs, charts, and other visual data is a critical skill. Infographics teach students how to analyze and communicate information effectively—skills they’ll use throughout their academic and professional lives.
HeadStart programs aim to provide young learners with foundational skills that set them up for success in school and beyond. Visual learning tools like infographics are particularly effective for younger children because they align with how kids naturally process information at an early age.
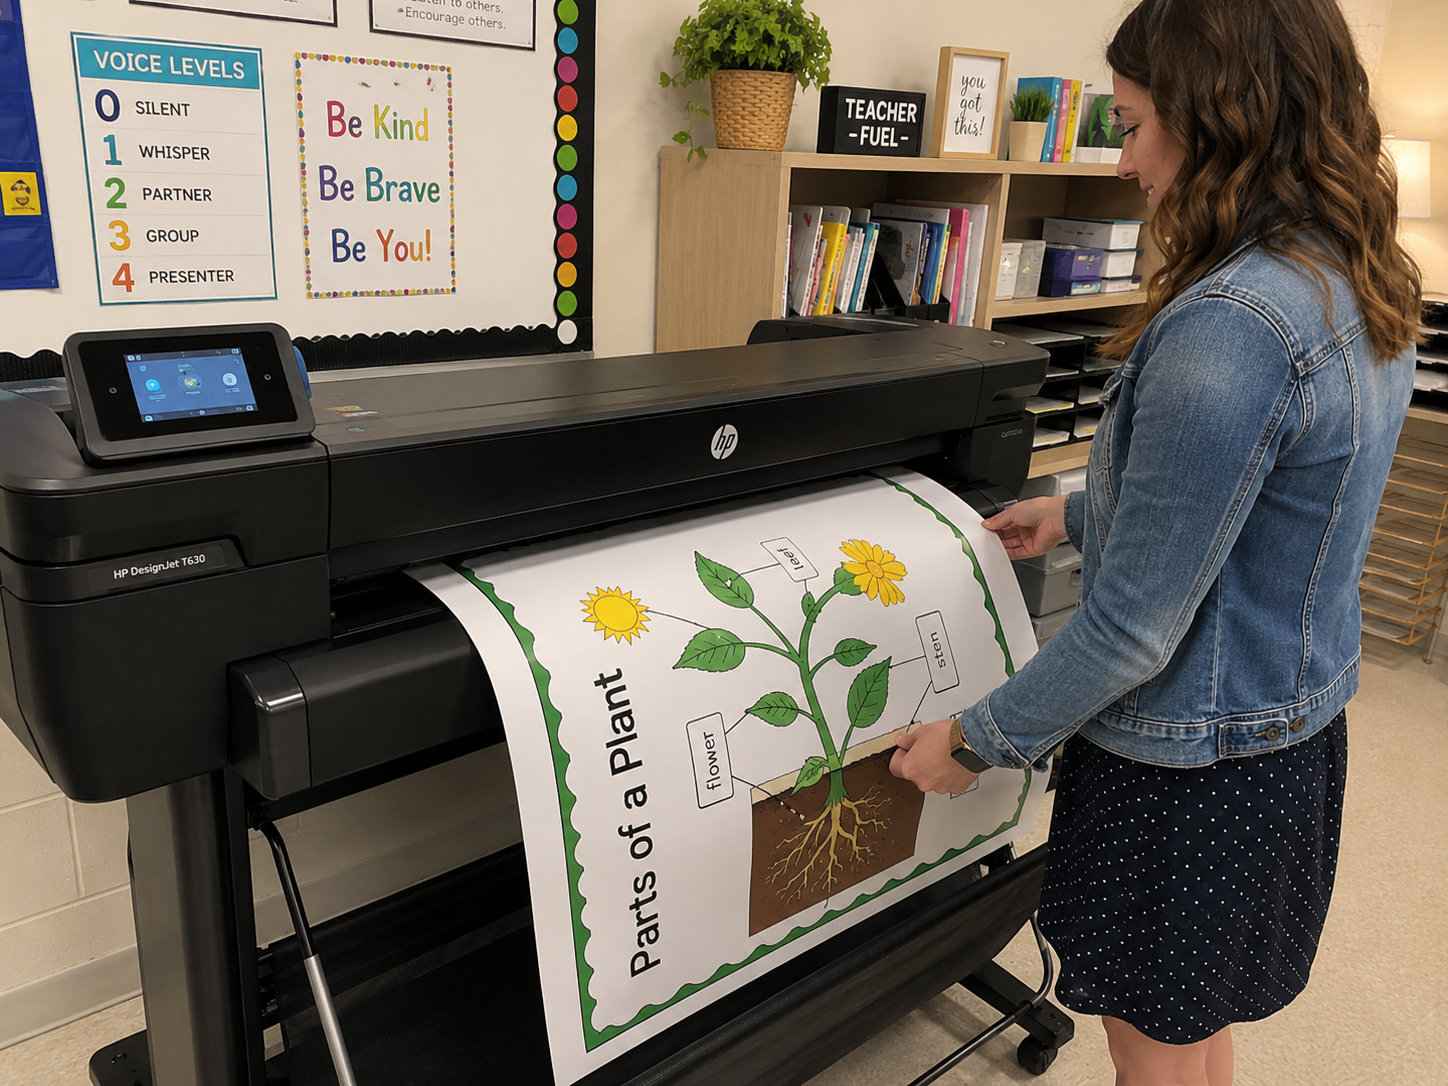
For example, an infographic on “The Life Cycle of a Butterfly” could combine colorful visuals with simple labels to teach biology basics in an accessible way.
Not all infographics are created equal! To design one that truly resonates with your audience—whether it’s preschoolers in HeadStart or high schoolers tackling AP Physics—you need to include these essential elements:
Your infographic should have one main goal or message. For instance: “How Solar Panels Work” or “The Basics of Coding.” Avoid cramming too much information into one design; simplicity is key.
STEM education requires precision. Always use reliable sources for your data and double-check facts before including them in your infographic.
Guide your audience through the content step-by-step using clear headings, numbered sections, or directional arrows.
Make sure the most important elements stand out by using larger fonts, bold colors, or prominent placement.
Use vibrant colors (but not too many), readable fonts, and appealing visuals like icons or illustrations that align with your topic.
Ready to create your own infographic? Follow these steps for success:
Pick a subject that benefits from visual explanation—examples include “The Periodic Table Explained,” “How Planets Orbit the Sun,” or “Understanding Fractions.”
Research reliable sources such as peer-reviewed journals, government websites (like NASA for space-related topics), or educational platforms like Khan Academy.
Decide how you’ll organize the information logically—for example:
Use user-friendly design tools like:
Incorporate charts (bar graphs for comparisons), icons (like atoms for chemistry), and eye-catching imagery related to your topic.
Before sharing your infographic:
Once you’ve created your infographic masterpiece, it’s time to put it into action! Here are some ways you can integrate infographics into your STEM curriculum:
Scientific literacy isn’t just about memorizing facts—it’s about understanding how science impacts everyday life and being able to communicate those ideas effectively. Infographics play a crucial role by:
For example, an infographic comparing renewable energy sources could spark meaningful discussions about sustainability while teaching students how to interpret bar graphs and pie charts.
Infographics aren’t just trendy visuals—they’re powerful educational tools that can transform how we teach STEM subjects and engage young learners in HeadStart programs. By simplifying complexity, boosting retention rates, and fostering creativity, they empower students at every level to connect with challenging material in new ways.
So what are you waiting for? Start designing your first infographic today! Whether it’s explaining Newton’s Laws of Motion or introducing preschoolers to basic math concepts through colorful visuals, the possibilities are endless—and the results will amaze you.
Remember: A picture is worth a thousand words—but an infographic could be worth a thousand “aha!” moments in your classroom!