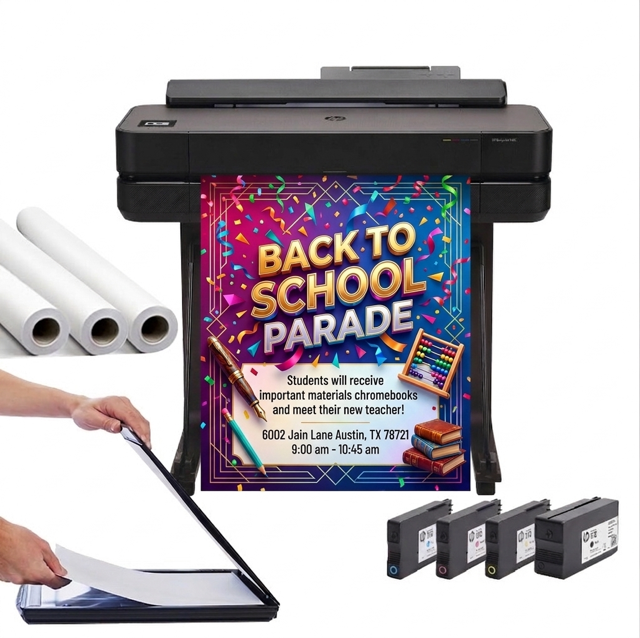

DISCOUNTED EDUCATION PRICING! CALL 1-877-891-8411. We Gladly Accept School Purchase Orders!
In today’s classrooms, where teachers juggle technology, curriculum standards, and student engagement, one timeless tool continues to stand out on classroom walls — the anchor chart. These colorful, student-centered visuals are more than just decoration; they’re powerful learning aids that help students connect concepts, retain knowledge, and build independence.
Picture a student struggling with fractions glancing up at a bright, neatly printed anchor chart that says, “Part over Whole = Fraction.” A small reminder like that can bridge a huge learning gap. Anchor charts quite literally anchor understanding — and when designed intentionally, they become one of the most effective visual learning tools in education.
In this post, we’ll explore how anchor charts enhance classroom learning, how to design them for maximum impact, and why high-quality visuals can transform the learning experience for every student.
Every classroom wall tells a story. Some display student art or project boards; others showcase seasonal themes. But anchor charts — when done right — tell a story of learning in progress. They capture lessons in motion and serve as reference points for students as they apply new skills.
At their core, anchor charts:
They’re called “anchor” charts because they literally anchor students’ thinking — keeping complex topics within visual reach long after the lesson ends.
And in a visually rich learning environment, this reinforcement is crucial. According to educational research, students retain up to 65% more information when it’s paired with visuals. That’s why teachers who use anchor charts consistently see stronger engagement, participation, and recall.
The power of anchor charts isn’t just anecdotal — it’s backed by brain science. Humans are visual learners by nature. Roughly 90% of the information processed by the brain is visual, and visuals are processed 60,000 times faster than text.
Here’s why that matters in the classroom:
In short, anchor charts transform the classroom into a living memory palace — where every wall reinforces learning.
When paired with crisp visuals, clear fonts, and bold color, their effect multiplies. Neatly printed or well-designed anchor charts command attention and invite interaction.
Anchor charts can support nearly every subject and grade level. Here are the top categories every teacher should consider displaying — each serving a specific instructional purpose.
These charts encourage students to use academic language confidently and structure their ideas clearly.
Math anchor charts help demystify abstract ideas, making them tangible and visual.
STEM visuals anchor complex processes in simplicity and clarity.
They give historical and spatial concepts a visual dimension that’s easy to remember.
SEL charts build community and emotional intelligence — an often-overlooked but vital component of student success.
A good anchor chart isn’t about artistry — it’s about clarity. The best charts are those that students can read, understand, and use independently.
Here are the essential design principles:
Stick to one concept per chart. Overloading visuals with too much information causes cognitive fatigue.
Your charts should be readable from across the room. Use large, easy-to-read fonts and limit yourself to 2–3 font styles.
Color helps categorize information. For example:
Even small icons — arrows, boxes, checkmarks — can guide the eye and aid recall.
When students help create charts (by brainstorming content or illustrating examples), they take ownership of their learning.
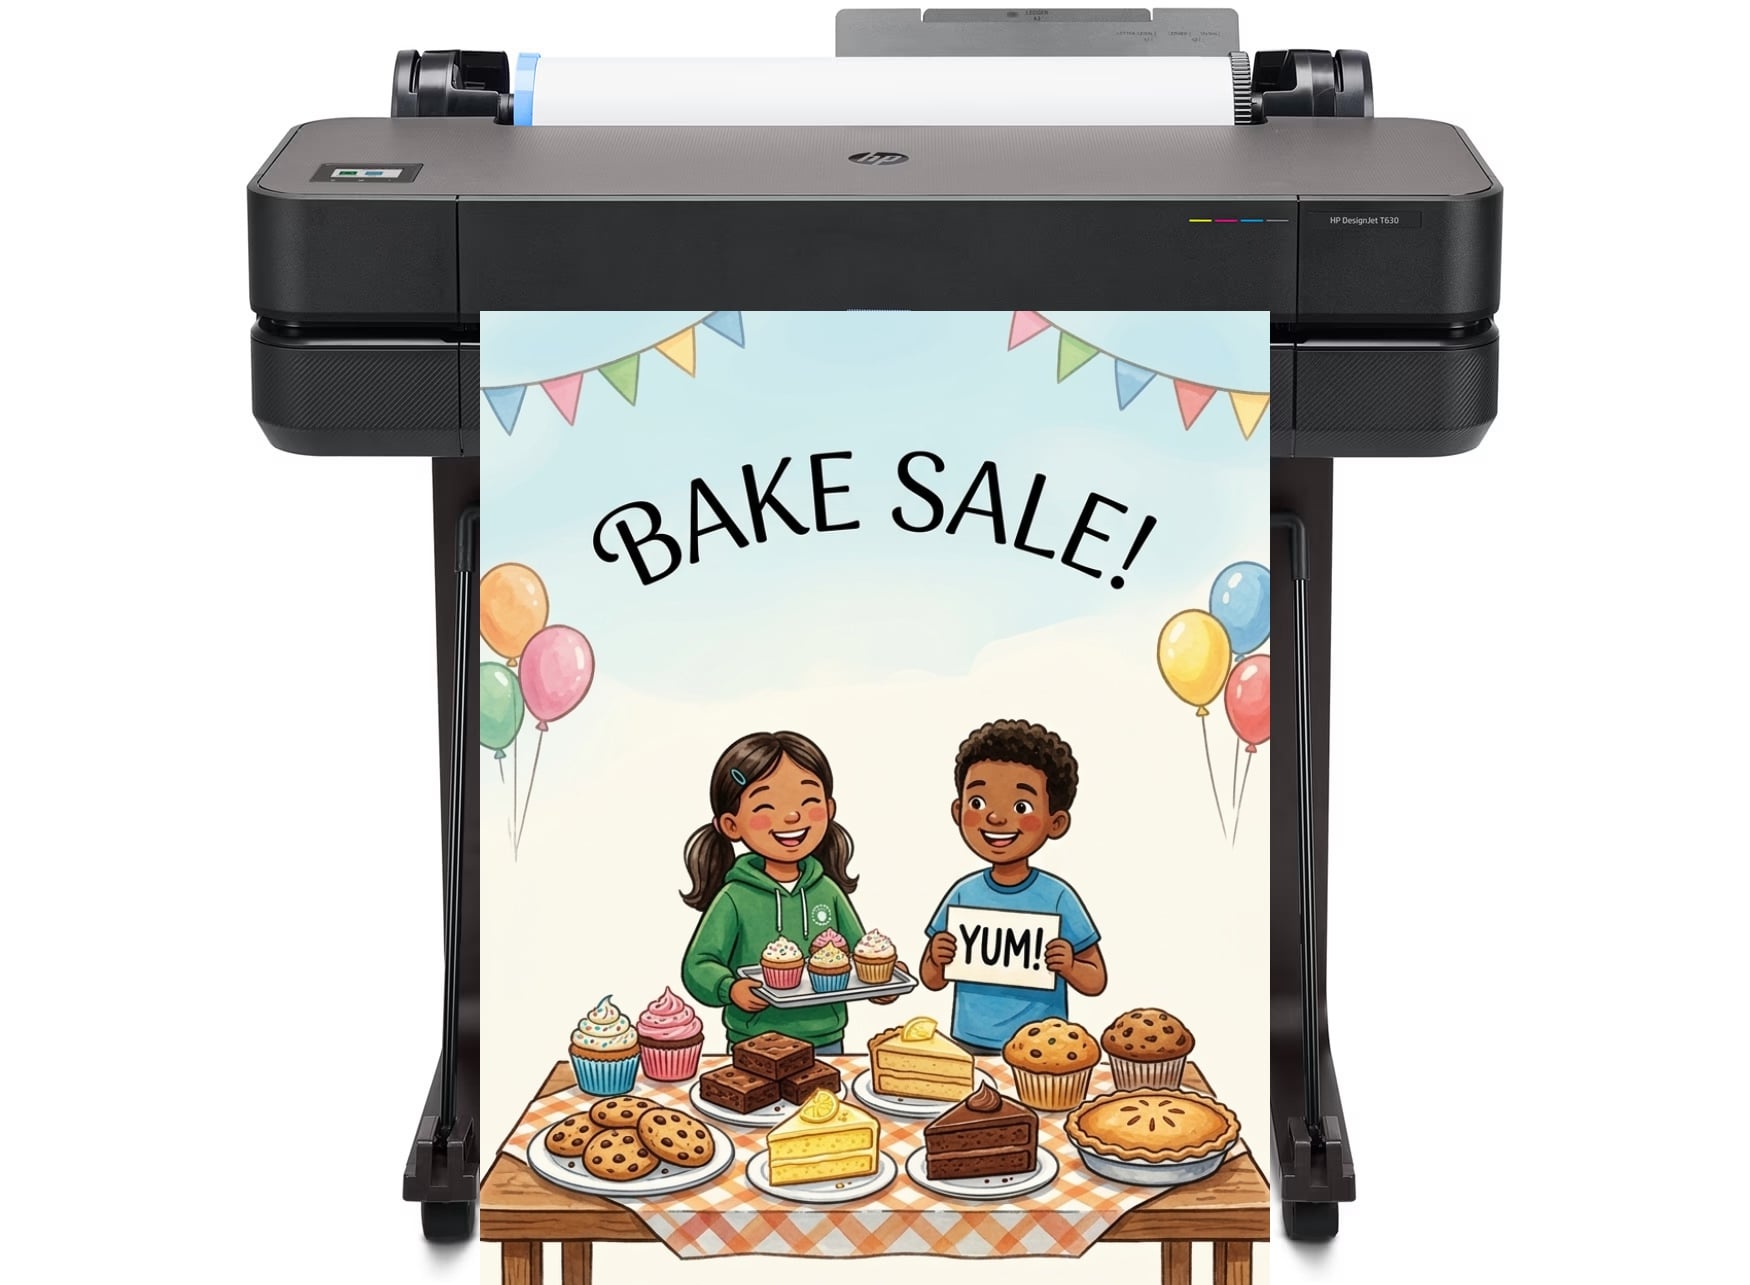
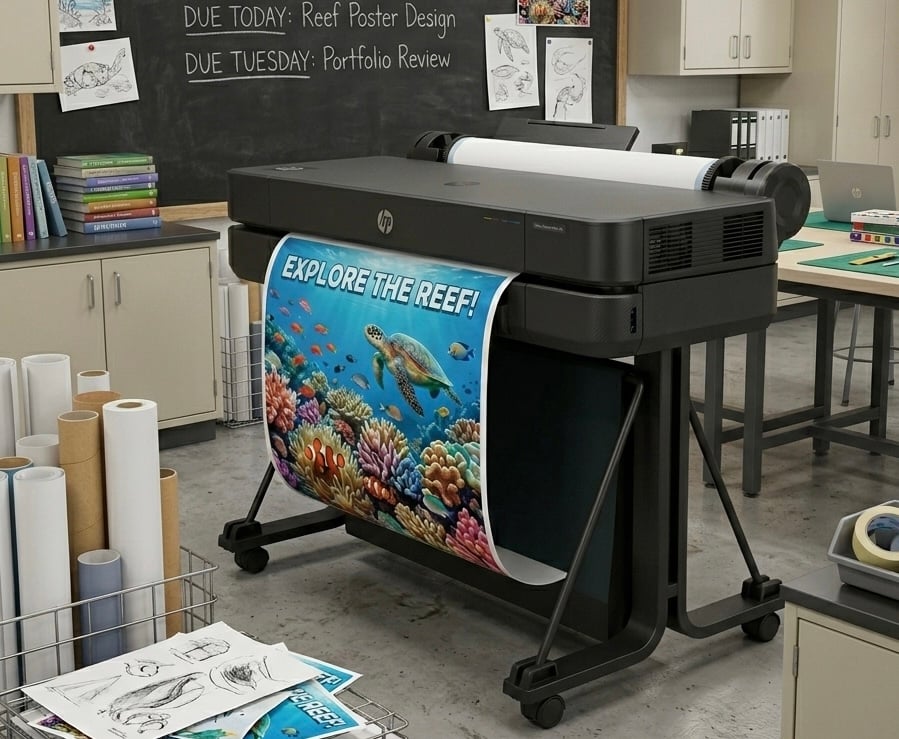
Handmade charts have heart, but printed or digital versions provide consistency, readability, and durability. Teachers can easily design in Canva or PowerPoint, print them on large-format paper, or display them digitally for remote learners.
In blended and hybrid classrooms, anchor charts are evolving beyond paper. Teachers now use digital anchor charts that can be projected, shared, or printed.
Digital charts work especially well for:
By creating digital anchor charts first, teachers can easily print high-quality versions for classroom walls. This hybrid approach — digital plus physical — ensures students always have access to visuals no matter where they learn.
Here’s how teachers can go from idea to finished classroom visual:
Anchor charts should always support a clear skill or standard. Ask yourself, “What do I want students to be able to do without my help?”
Look for examples on Pinterest, Canva templates, or educational resource sites. Keep an eye on structure, font choice, and color hierarchy.
Print your anchor charts on durable poster paper for vibrant results. Laminating them can extend their lifespan and allow you to reuse them year after year.
Hang charts at student eye level and keep them grouped by subject. Rotating them monthly keeps visuals fresh and relevant.
Anchor charts don’t have to sit passively on the wall — they can be interactive, evolving, and deeply engaging. Here are creative approaches:
Use sticky notes for student contributions or questions. For example, a “Main Idea” chart can have removable examples students add over time.
Rotate charts around the classroom in stations, where students apply the skill shown on each chart.
Dedicate one wall to a “Learning Gallery” organized by subject or unit. Use color-coded headings for quick recognition.
Let small groups design charts for mini-lessons. This approach gives students ownership, creativity, and confidence in their learning.
Add QR codes linking to short videos, online exercises, or student exemplars. It turns a static chart into an interactive resource.
Anchor charts work best when they evolve with instruction.
This keeps your classroom visually dynamic — and ensures charts remain purposeful, not wallpaper.
Beyond academics, anchor charts play a huge role in shaping classroom identity.
When students see affirmations like “We can do hard things” or “Mistakes help us grow” displayed prominently, those messages become part of your classroom’s emotional landscape.
They remind students of shared norms, values, and the importance of persistence — all crucial to social-emotional growth.
And because these charts stay visible year-round, they quietly reinforce community expectations long after the first week of school.
Let’s face it — a chart’s effectiveness partly depends on how it looks. Faded ink, cluttered text, or poor contrast can all reduce its impact. High-quality visuals, whether hand-drawn or printed, help students focus on the message instead of the mess.
When anchor charts are designed clearly — with balance, spacing, and strong color contrast — they do more than inform; they invite participation. A well-made chart communicates, “This classroom values clarity, creativity, and shared learning.”
Anchor charts are more than posters — they’re conversation starters, memory aids, and confidence builders. They transform blank walls into living lessons and empower students to find answers independently.
When designed with purpose and clarity, they help teachers create an environment where students don’t just learn for the moment — they learn for life.
So, the next time you create a new anchor chart, think beyond the markers and paper. Think about the message it sends, the skill it reinforces, and the student who might glance up and suddenly get it.
That’s the real magic of an anchor chart — it doesn’t just stick to the wall. It sticks in the mind.