
DISCOUNTED EDUCATION PRICING! CALL 1-877-891-8411. We Gladly Accept School Purchase Orders!

In the fast-paced world of education, educators face an ongoing challenge: how do we keep students engaged while ensuring they retain the information? Enter visual learning—a powerful tool that can transform how students process and remember knowledge. Visuals aren’t just pretty pictures on a page; they are essential components of the learning process. From images to infographics, videos, and interactive diagrams, visuals can help learners grasp complex ideas, stimulate engagement, and significantly boost retention.
In this article, we explore why visuals are so effective for student retention, the science behind them, and how to incorporate visual learning strategies into everyday lessons to optimize student success. We’ll also highlight key studies, best practices, and expert insights that show why you should embrace visual learning techniques in your classroom today.
Humans are visual creatures. According to neuroscientific research, the brain processes visual information 60,000 times faster than text-based information. The simple act of viewing an image or a video triggers emotional responses, which helps the brain encode that information into long-term memory. It’s not just about seeing—it’s about feeling. Visuals have the power to evoke emotional reactions, which in turn create stronger neural connections, making the learning experience more memorable.
Our brains are wired for visuals. In fact, approximately 50% of the brain’s cortex is involved in processing visual information. This vast section of our brain interprets everything from color and shape to motion and depth, making visuals one of the most powerful forms of communication.
For instance, when students see a chart or graph illustrating a scientific concept, the brain processes this data holistically and faster than if they were simply reading a description of the concept. This is because visuals stimulate the brain’s occipital lobe—the area responsible for visual processing.
Research shows that learners retain up to 65% of information when visuals are used, compared to only 10% of information when listening to a lecture and 20% when reading text. The use of visuals also helps clarify abstract or complex concepts, simplifying what would otherwise be difficult to grasp.
One of the foundational theories supporting the effectiveness of visual learning is Dual-Coding Theory, introduced by psychologist Allan Paivio in the 1970s. This theory posits that the brain processes verbal and visual information in two distinct channels. When both are utilized together, information is processed more deeply, resulting in better memory retention. This explains why a combination of images and text, such as infographics or annotated diagrams, is far more effective than just a text-heavy slide or a spoken lecture.
In an age where distractions are constant, it’s hard to capture and keep students’ attention. Visual aids, however, grab attention and hold it longer than text-based material. According to a study conducted by Mindshift on the role of visuals in the classroom, students who interacted with visual learning tools were 89% more likely to remain focused and engaged throughout the lesson.
The human eye is naturally drawn to color, movement, and images. By incorporating vibrant visuals into your lessons—whether through videos, animated charts, or interactive graphics—you tap into the brain’s intrinsic ability to process visual data quickly. This creates an immediate connection between the student and the material, heightening their focus and interest in the topic.
Sometimes, even the brightest students struggle to comprehend complicated theories or concepts. That’s where visuals shine. Diagrams, flowcharts, and infographics can simplify complex ideas by breaking them down into bite-sized, digestible pieces. For example, students often struggle with understanding how the water cycle works, but a simple diagram showing evaporation, condensation, and precipitation makes it easier to visualize and understand the process. By using visuals to represent abstract concepts, educators help bridge the gap between theory and reality, making difficult topics more accessible.
In any classroom, students have diverse learning preferences. Some students may learn best through listening, while others are more kinesthetic learners, and some thrive when they can see the information. Visual learning benefits all students by providing an alternative way to interact with content. According to the Learning Styles Theory proposed by Howard Gardner, people have multiple ways of learning, and visual learning supports at least two of these modes: spatial intelligence (the ability to visualize and mentally manipulate objects) and linguistic intelligence (processing words and symbols).
With the integration of visuals, students who might not excel with text-heavy content can still succeed and engage with the material in a way that suits their learning style.
Now that we understand why visuals work, let’s dive into some practical ways educators can implement visual learning in their teaching practices.
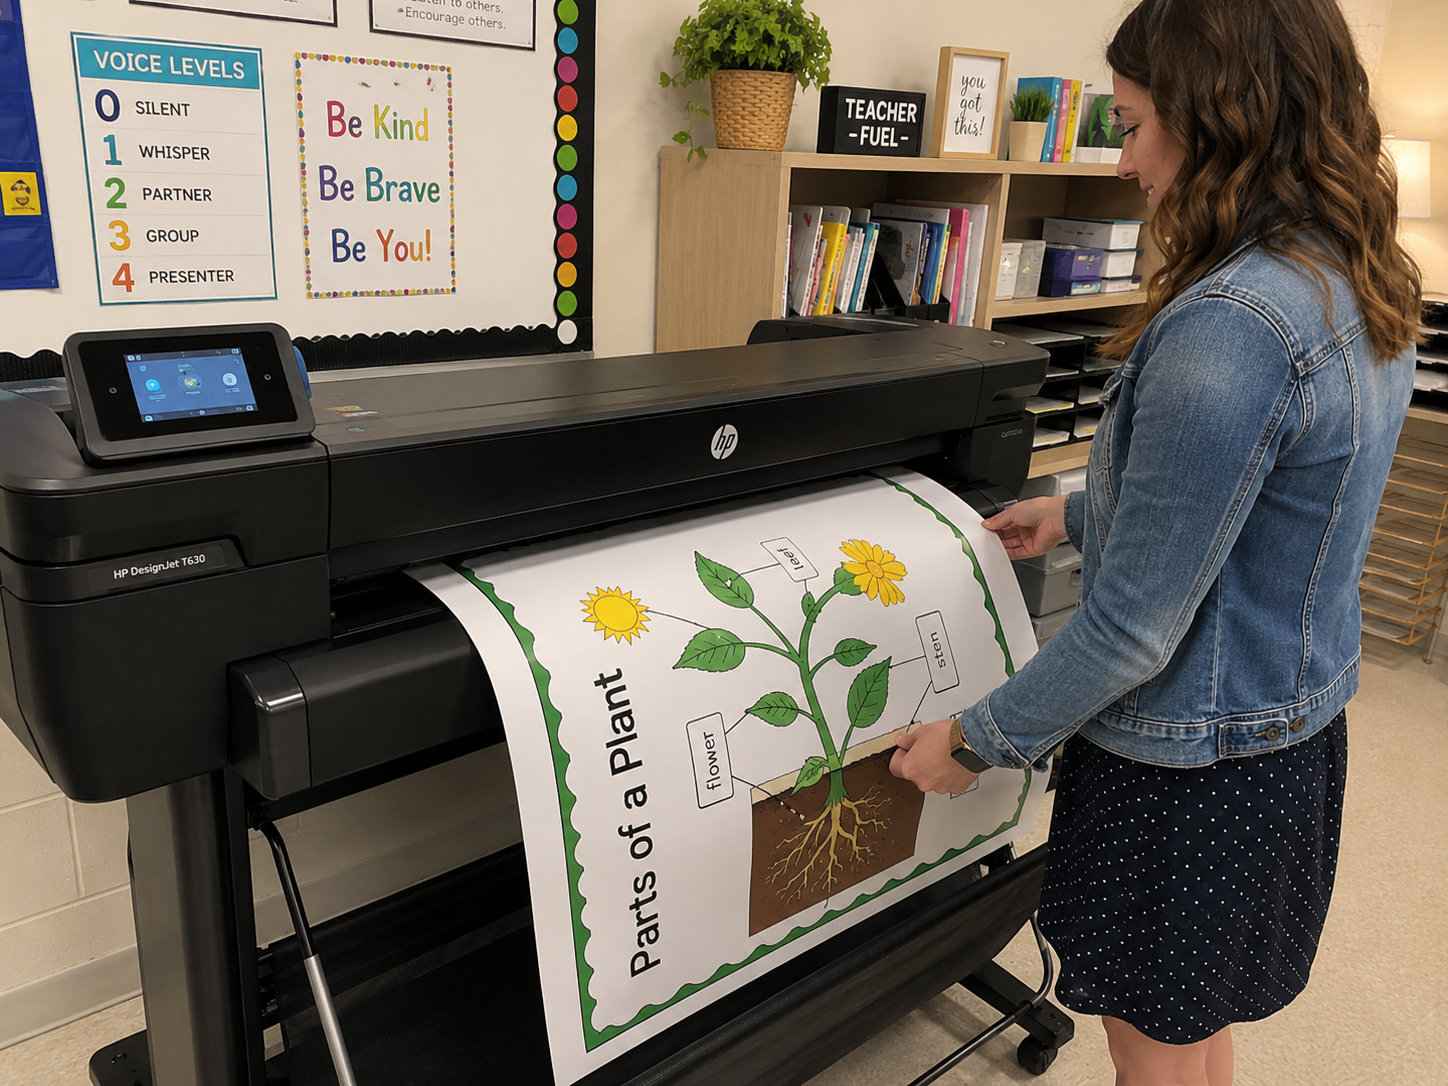
Infographics are an excellent way to condense and summarize information visually. They combine graphics, text, and data to present a story in a way that’s both informative and engaging. Concept maps, on the other hand, help students organize their thoughts, see the relationships between ideas, and understand how concepts fit together. A helpful way to print visuals is with a school poster maker.
For example, when teaching students about the structure of an ecosystem, a concept map that shows the interrelationships between producers, consumers, and decomposers can help them understand the system’s complexity.
Tools like interactive quizzes, simulations, and virtual labs can bring abstract concepts to life. These tools give students the opportunity to visualize and manipulate elements of the topic they’re learning about, reinforcing concepts through active participation.
For example, platforms like Kahoot! or Quizlet allow students to interact with content visually through flashcards or quizzes that feature images alongside questions, making the learning experience more immersive.
Videos are one of the most engaging forms of visual content. They combine narration, animation, and images to present information in an entertaining yet informative way. According to Edutopia, students are more likely to remember information when it’s delivered through video rather than text alone.
Platforms like Khan Academy, TED-Ed, and YouTube Edu provide educational videos that students can use to review or learn new concepts at their own pace. These videos can be particularly helpful in subjects like science and mathematics, where visual explanations can make concepts like chemical reactions or calculus much easier to understand.
Data can often be abstract and difficult to interpret. Tools like Google Charts or Tableau allow students to visualize data sets and identify trends, patterns, and anomalies. Visualizing data helps students grasp complex relationships between variables, making the information more memorable and easier to understand.
Visual storytelling takes advantage of images, videos, and animations to help students understand and remember historical events, literature, or scientific phenomena. By weaving a narrative into the visuals, students are more likely to engage with the content on a deeper level.
For instance, when studying historical events like the Civil War, using animated maps and photos can help students visualize the movement of troops, battles, and key locations, transforming abstract history into a tangible, relatable experience.
Visual learning is more than just a trend—it’s a proven method that enhances student retention, boosts engagement, and makes learning more accessible for all types of students. As educators, embracing visual learning strategies will not only make lessons more interactive but will also equip students with the tools they need to process and retain information more effectively.
Incorporating visuals into your curriculum doesn’t have to be complicated or time-consuming. With countless free and accessible resources at your fingertips, from educational videos to interactive software, there’s no excuse not to harness the power of visuals in your teaching.
By embracing visual learning, you’re doing more than teaching students; you’re empowering them to become better thinkers, learners, and problem-solvers. As we continue to understand the science behind how we learn, it’s clear that visuals are an indispensable part of that process.
References:
Supporting Studies and Resources