
DISCOUNTED EDUCATION PRICING! CALL 1-877-891-8411. We Gladly Accept School Purchase Orders!
In the modern classroom, teachers face a challenge: how do you capture attention, spark curiosity, and make complex concepts stick when students are bombarded with distractions? The answer, increasingly backed by research, is teaching with visuals.
Classroom visuals—from posters and anchor charts to infographics and multimedia—aren’t just decorations. They are essential learning tools that improve comprehension, boost retention, and support students of all abilities. In fact, according to the Journal of Educational Psychology, students learn and remember up to 65% more information when visuals are integrated into lessons compared to text alone.
This in-depth guide explores the role of visuals in teaching, the benefits for students, and practical strategies for educators. Whether you’re a new teacher or a seasoned educator, these insights will help you create a classroom where visuals do the heavy lifting in learning.
School visuals matter. If you’ve ever watched a student’s eyes light up at a diagram, timeline, or poster, you’ve seen firsthand the power of classroom visuals.
👉 Snippet-Friendly Q&A:
Q: Why are visuals important in the classroom?
A: Visuals make learning engaging, improve comprehension, boost retention, and support diverse learners, including English language learners and special education students.
When we talk about classroom visuals, we mean any teaching tool that presents content in a visual, easy-to-digest way.These range from printed posters to high-tech interactive displays.
👉 Snippet-Friendly Q&A:
Q: What are classroom visuals?
A: Classroom visuals are learning tools—like posters, anchor charts, infographics, and schedules—that present information visually to improve understanding and retention.
The best teachers don’t just “add” visuals—they integrate them into instruction.
The human brain is wired for visuals. In fact:
This explains why a poster of classroom rules is far more effective than a list read aloud once. Or why infographics in science make complicated processes like photosynthesis easier to grasp.
👉 Snippet-Friendly Q&A:
Q: How do visuals improve learning?
A: Visuals improve learning by making abstract ideas concrete, speeding up processing, and strengthening memory, helping students understand and remember concepts longer.
Let’s break down the most impactful visuals teachers should use and why they work.
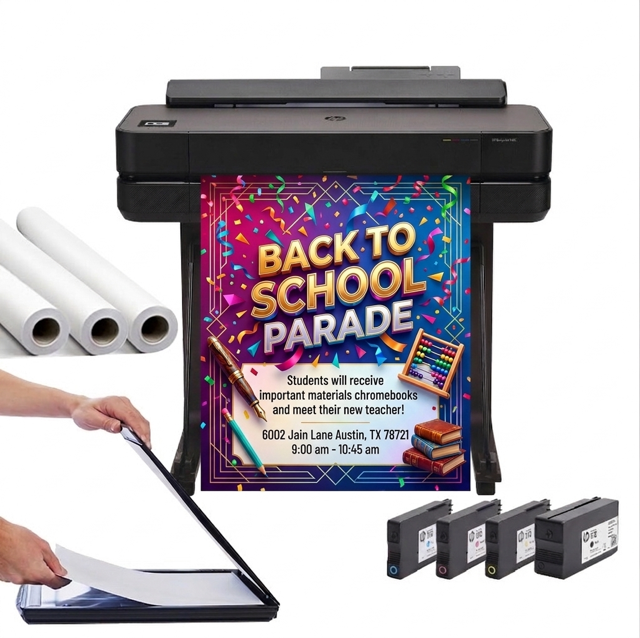
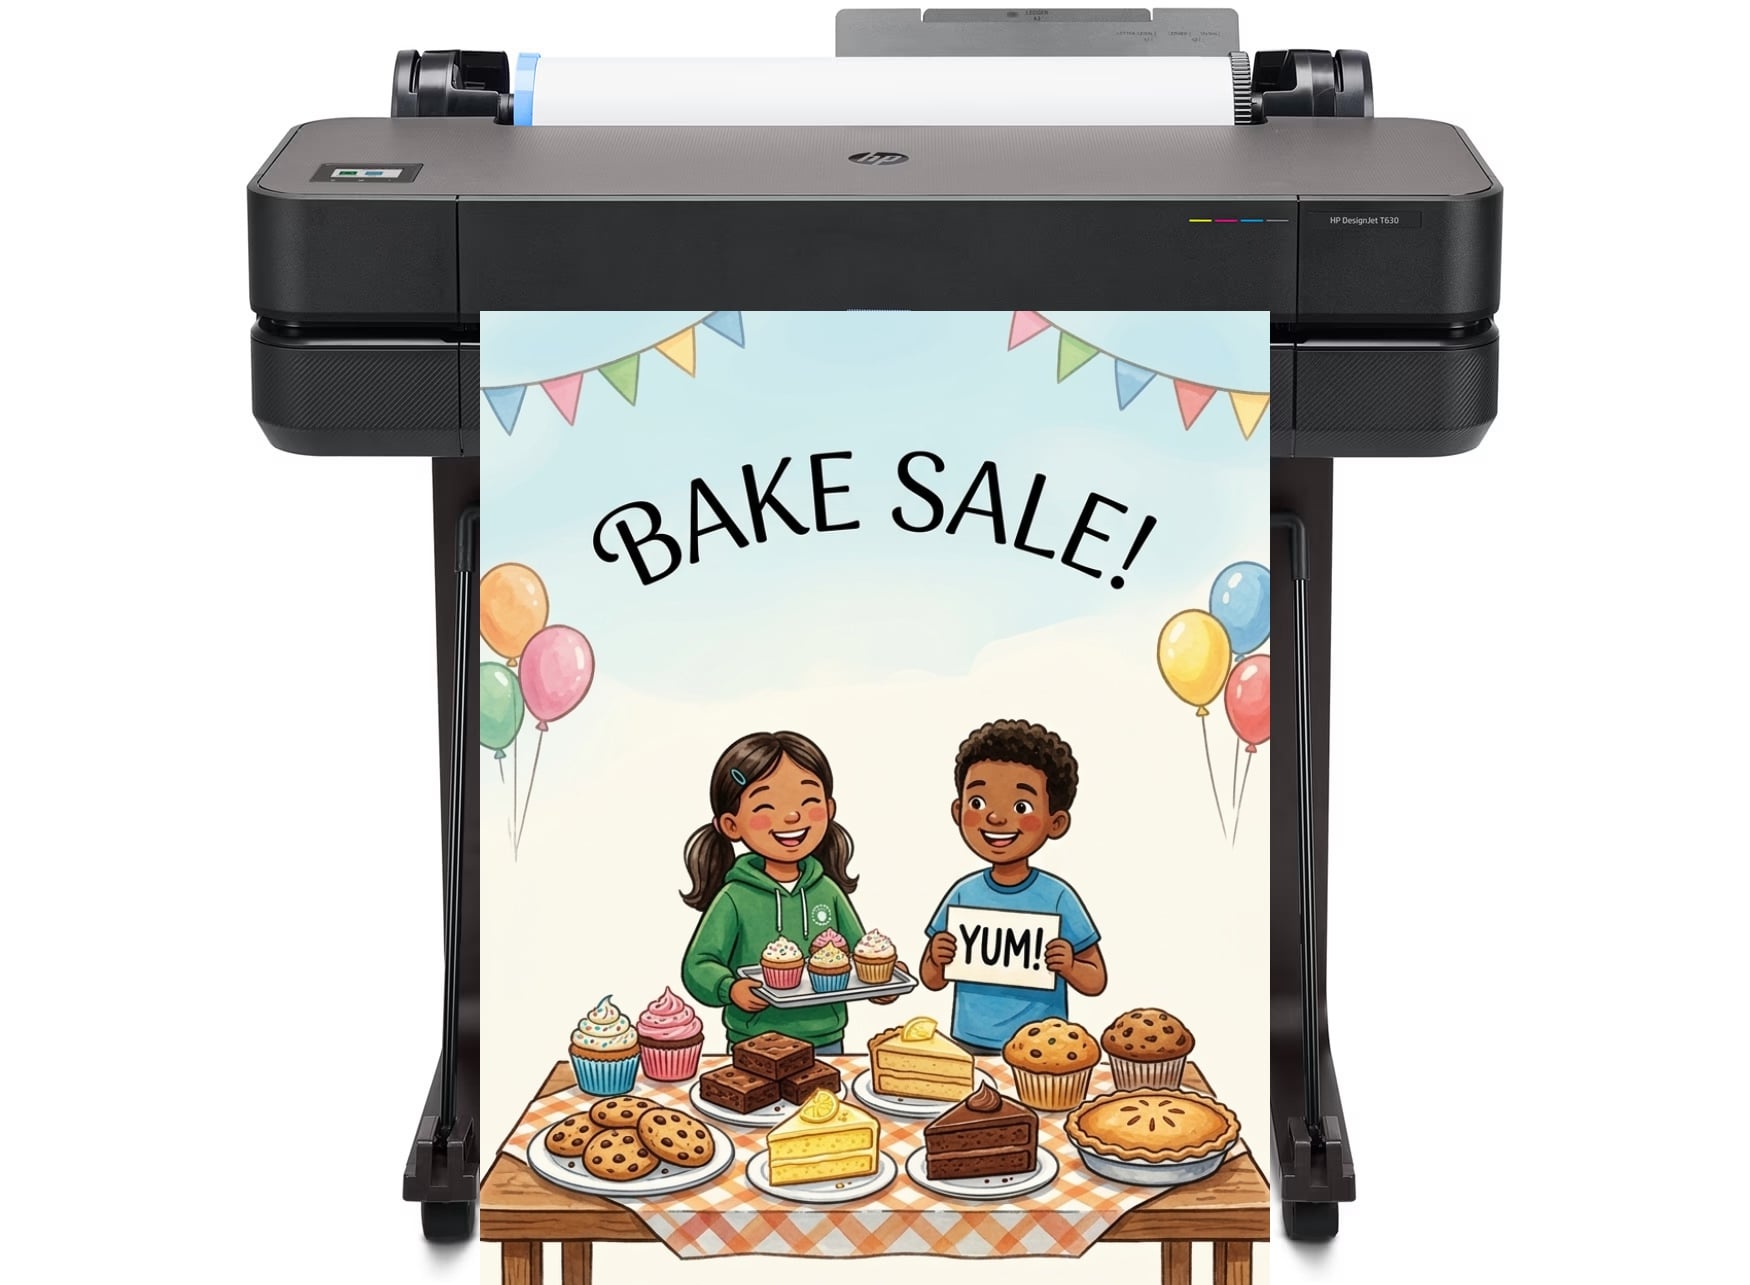
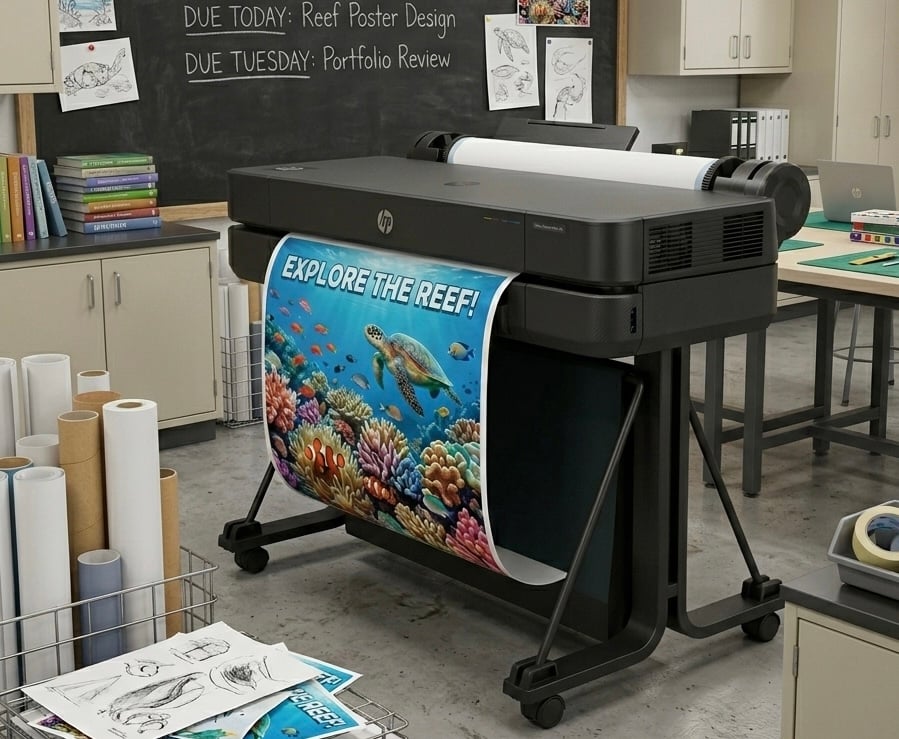
Classroom posters are one of the most cost-effective and versatile visuals. With a school poster maker, teachers can print oversized learning aids that are engaging, durable, and reusable.
Examples: Math fact posters, inspirational quotes, science diagrams.
👉 Long-tail keyword angle: Teaching with posters in the classroom improves recall and creates daily reference points for students.
Anchor charts are teacher- or student-created visuals that capture key learning moments. Unlike static posters, these evolve with class discussion.
Examples: Reading strategies, writing prompts, problem-solving steps.
Infographics turn dense information into colorful, student-friendly visuals. These are especially powerful for middle and high school learners.
Examples: Historical timelines, life cycles, environmental data.
Essential for special education classrooms, these visuals provide routine, reduce anxiety, and promote independence.
Examples: Daily schedules with images, classroom procedure cards.
Technology has expanded visuals beyond print. Interactive whiteboards, slideshows, and video clips engage digital-native students.
Simply hanging posters isn’t enough—strategy matters.
👉 Snippet-Friendly Q&A:
Q: How do teachers use visual aids effectively?
A: Teachers use visuals effectively by aligning them with lesson goals, keeping designs simple, using color coding, and encouraging student interaction.
Visuals aren’t just helpful—they are often critical in special education settings.
👉 Snippet-Friendly Q&A:
Q: How do visuals support special education?
A: Visuals give special education students structure, communication tools, and independence by simplifying routines and reinforcing behavior expectations.
Teachers today don’t need to hand-draw every chart—there are powerful tools for creating professional visuals quickly.
👉 Snippet-Friendly Q&A:
Q: What are the best tools for creating classroom visuals?
A: Teachers can use poster makers, Canva for Education, Google Slides, and Adobe Express to design professional-quality classroom visuals.
Teaching with visuals is far more than a fleeting trend—it’s a proven, research-backed strategy that revolutionizes how students learn and engage in the classroom. School visual aids such as posters, anchor charts, infographics, and digital displays are not mere supplements to instruction; they are powerful engines that drive comprehension, boost engagement, and enhance long-term retention of information. By thoughtfully integrating visuals into their teaching, educators can create dynamic, inclusive, and effective learning environments where complex ideas become accessible and memorable.
The human brain is wired to process visual information more efficiently than text alone. Research, such as studies based on dual-coding theory, demonstrates that combining verbal and visual information allows students to process and retain knowledge more effectively. Classroom visuals help students make connections between abstract concepts and tangible representations, fostering deeper understanding. For instance, a well-designed infographic can simplify complex scientific processes, while an anchor chart can serve as a constant reference for reinforcing math strategies or literary concepts.
By integrating visuals intentionally, teachers create classrooms where learning is visible, accessible, and lasting.Schools that invest in poster makers and other visual tools set both teachers and students up for success.
👉 Snippet-Friendly Q&A:
Q: Why should teachers use visuals in teaching?
A: Teachers should use visuals because they make learning accessible, memorable, and engaging—boosting comprehension, retention, and student success.