
DISCOUNTED EDUCATION PRICING! CALL 1-877-891-8411. We Gladly Accept School Purchase Orders!
In today’s classrooms and training environments, visual aids have moved from being “nice-to-have” extras to becoming essential tools for engagement, comprehension, and long-term retention. Research in cognitive science consistently shows that people learn better when information is presented visually as well as verbally—a concept known as dual coding theory. Whether you’re teaching in a K–12 classroom, leading corporate training, or presenting at a university lecture, using the right visual aids can make the difference between passive listening and active learning.
In this guide, we’ll explore the 8 best types of visual aids for learning, why they work, and how you can implement them effectively.
Before diving into the list, it’s worth understanding why school visual aids are such powerful educational tools. Studies reveal that:
Put simply: when used correctly, visual aids don’t just decorate a lesson. They transform learning into something interactive, memorable, and accessible for all students.
Infographics combine visuals, text, and data into an easy-to-digest format. They are especially effective for summarizing large amounts of information or illustrating step-by-step processes.
An infographic is a visual learning tool that combines images, icons, and text to simplify complex information. Teachers use them to break down processes, timelines, or data into a format students can quickly understand and remember.
A history teacher might use an infographic timeline to show the progression of events leading up to World War II. Students can instantly see cause-and-effect relationships without being buried in paragraphs of text.
Tools like Canva or Adobe Express allow even non-designers to create professional-quality infographics. Keep them uncluttered—too much information defeats their purpose.
Data can be abstract and overwhelming. Charts and graphs—bar charts, pie graphs, line graphs—turn raw numbers into visual stories that highlight patterns, trends, and relationships.
In science class, instead of reading a table of numbers about plant growth under different light conditions, students analyze a bar graph comparing results. The takeaway becomes obvious at a glance.
Always pair graphs with questions or prompts. For example: “What trend do you notice here?” or “What prediction can we make based on this graph?” This ensures learners don’t just see the data but interact with it.
Sometimes words alone can’t describe a process or structure effectively. That’s where school visual aids like diagrams and illustrations shine.
Diagrams are important because they simplify complex processes and show connections between parts of a system. Instead of memorizing isolated facts, students understand how concepts fit together.
In biology, a labeled diagram of the human circulatory system helps students see how veins, arteries, and the heart work together. Instead of memorizing disconnected terms, learners understand the big picture.
Use color coding to highlight relationships—for instance, oxygenated vs. deoxygenated blood in science diagrams. Color anchors memory.
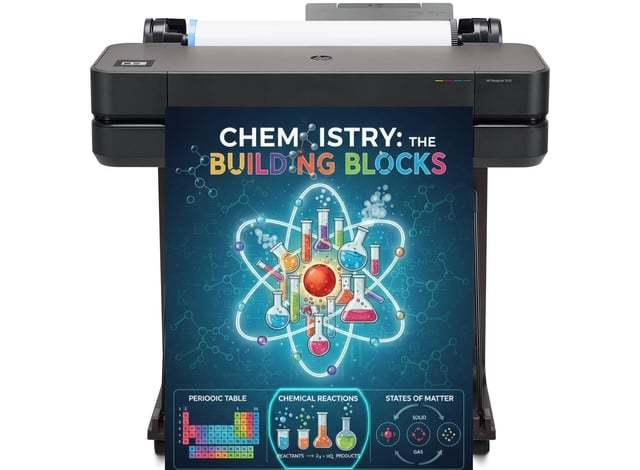
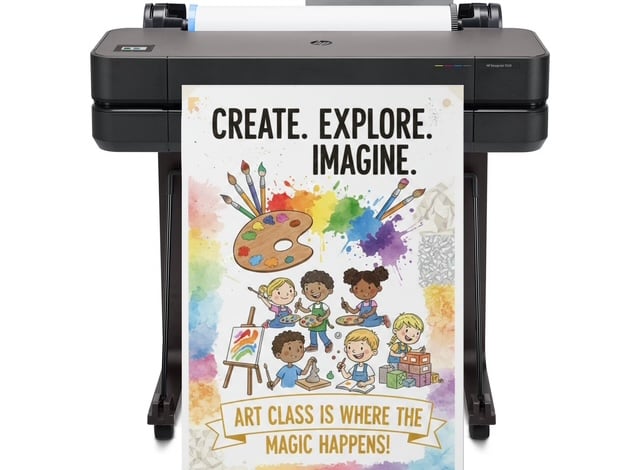
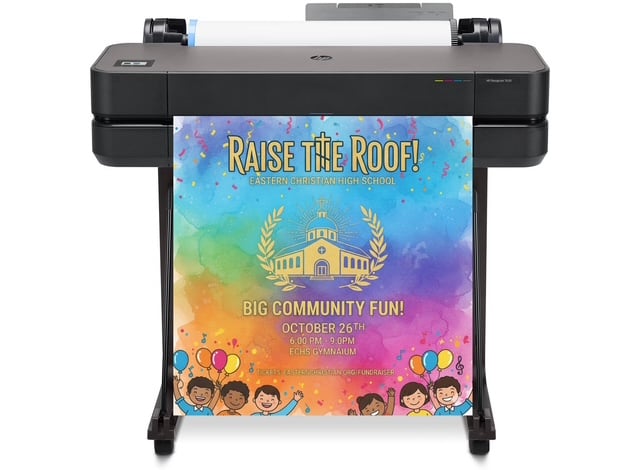
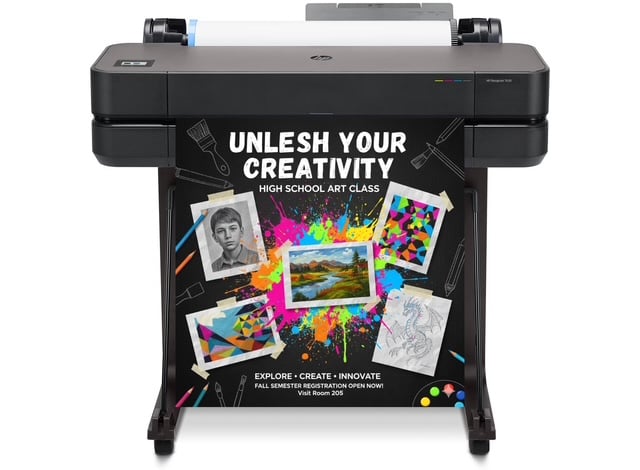
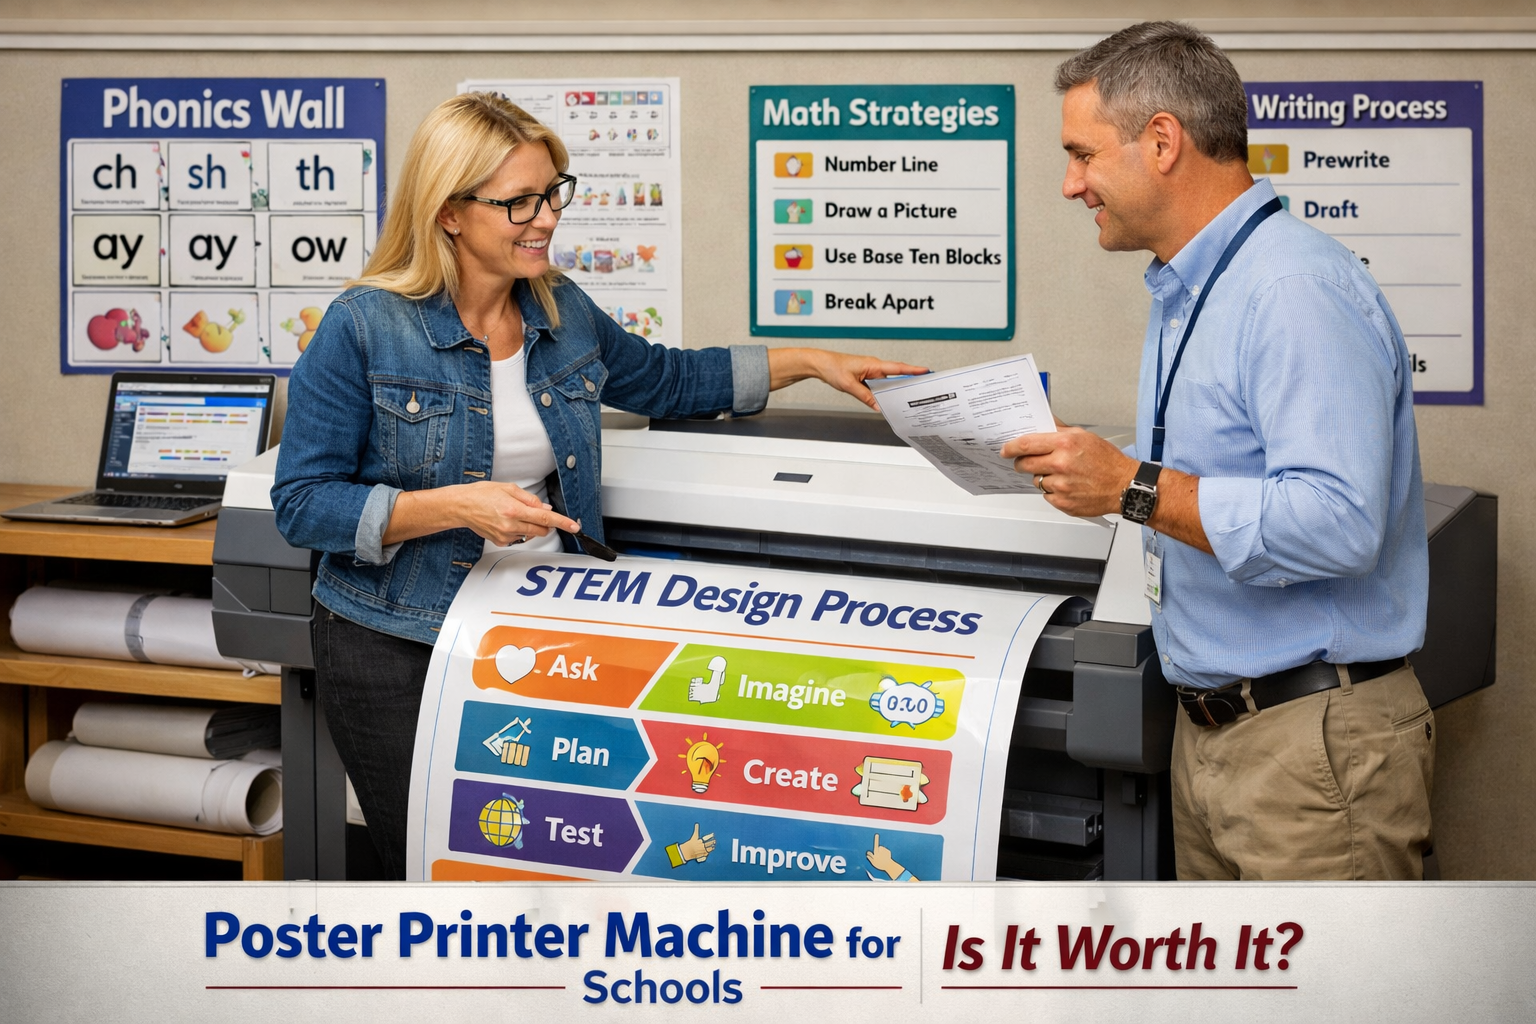
Unlike temporary slides or handouts, posters provide constant reinforcement. A well-designed classroom display acts as a silent co-teacher, reminding students of key concepts day after day.
A math teacher creates a poster showing common geometry formulas. Students see it daily, and by the time tests arrive, the formulas feel familiar.
Don’t crowd posters with too much text. Use bold headings, large visuals, and color coding. For maximum impact, use a poster printer so the graphics are large enough to be seen from the back of the room.
PowerPoint, Google Slides, or Keynote presentations remain classroom staples, but they are only effective when designed well.
In an English class, a teacher uses slides to show key quotes from a novel alongside images and short videos from the time period. This transforms abstract literary analysis into a vivid, contextualized discussion. School Visuals are a powerful tool for learning.
Follow the “less is more” rule: fewer words, more visuals. Use high-quality images, animations sparingly, and consistent fonts. And never just read the slides aloud—slides should support, not replace, teaching.
When it comes to engagement, few tools match the power of video. From quick clips to animated explainers, video appeals to students’ love of multimedia while explaining complex ideas in accessible ways.
In physics, an animation of Newton’s laws in action (showing a ball rolling, colliding, and stopping) makes the laws intuitive rather than theoretical.
Keep videos short (under 5 minutes) and always pause for discussion or note-taking. Passive watching doesn’t equal learning. Interactive video platforms like Edpuzzle can embed quizzes within videos.
Not all visual aids are flat. Physical models and hands-on manipulatives turn abstract ideas into tangible, 3D experiences.
Manipulatives are hands-on teaching tools (like blocks, fraction tiles, or 3D models) that help students understand abstract concepts by physically interacting with them.
An elementary teacher uses fraction tiles to help students visualize and compare fractions. Instead of memorizing that 1/2 is bigger than 1/3, students see and feel the difference.
DIY models (like building atom models with marshmallows and toothpicks) can be just as effective as store-bought versions. The act of creating the school visuals model enhances learning.
Mind maps (radiating ideas outward) and concept maps (hierarchical connections) are powerful for organizing and visualizing knowledge.
Before writing an essay, students build a concept map linking their thesis to supporting evidence and counterarguments. This not only improves organization but also strengthens critical thinking.
Use digital tools like MindMeister or Miro for collaborative mapping. For younger learners, colorful paper mind maps with images and stickers can make brainstorming fun.
No matter which visual aid you choose, the following strategies ensure effectiveness:
The eight types of visual aids—infographics, charts, diagrams, posters, slide decks, videos, models, and mind maps—are more than just “extras” in teaching. They are core tools for making learning effective, inclusive, and engaging.
In an era where attention spans are shrinking and information overload is constant, the right visual can cut through the noise and make knowledge stick. Whether you’re an educator, trainer, or presenter, incorporating visual aids isn’t just best practice—it’s essential for helping learners succeed