Introduction: Anchor Charts as the Heartbeat of Classroom Stories
Imagine a classroom where every lesson feels like a chapter in an unfolding adventure, where students aren’t just learning but living the material through stories they help shape. Anchor charts, often seen as simple visual aids, have the potential to be so much more—they can be the vibrant storyboards of your classroom, weaving lessons into narratives that spark curiosity, deepen understanding, and create lasting memories. By infusing storytelling into anchor charts, you transform abstract concepts into relatable journeys that students co-create and cherish. This comprehensive guide explores how to craft story-driven anchor charts that ignite engagement, foster inclusivity, and make learning a collaborative adventure. With detailed steps, creative examples, reflective prompts, and a wealth of resources, this guide is your blueprint for turning anchor charts into powerful tools for classroom transformation.
Why Story-Driven Anchor Charts Matter
Anchor charts are more than posters—they’re dynamic tools that anchor learning by making it visible, interactive, and memorable. When designed as stories, they do something magical: they tap into students’ emotions, connect lessons to their lives, and create a shared classroom narrative. Here’s what makes a story-driven anchor chart exceptional:
- Emotional Connection: Stories engage the heart, making abstract concepts feel personal and relevant.
- Collaborative Creation: Students become co-authors, contributing ideas, art, or examples that shape the chart.
- Inclusivity: Visuals, multilingual elements, and tactile features ensure every learner can participate.
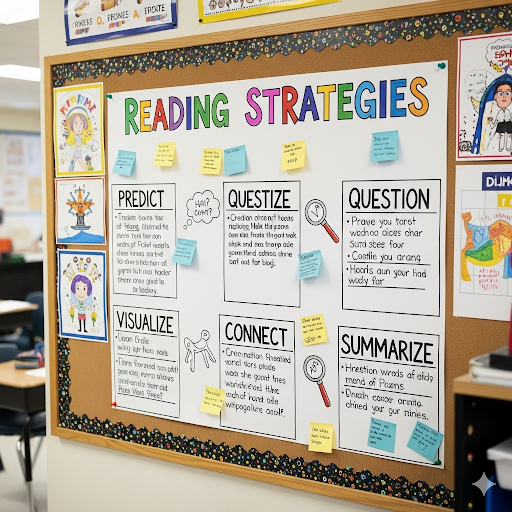
- Visual Storytelling: Thoughtful designs with thematic graphics and clear layouts reinforce the narrative.
- Longevity: Flexible charts evolve with lessons, staying relevant across units or years.
This guide will walk you through creating anchor charts that don’t just teach but inspire, turning your classroom into a space where every student feels like a hero in the story of learning.
Step-by-Step Guide to Crafting Story-Driven Anchor Charts
Step 1: Craft a Narrative That Resonates
Every great anchor chart starts with a story that hooks students. Choose a narrative theme that ties the lesson to something students care about or find exciting. Consider their interests, cultural backgrounds, or favorite books and movies. Here are some ideas to spark inspiration:
- Math: Turn decimals into a “Treasure Hunt,” where students navigate a map to find hidden values.
- Language Arts: Frame grammar as a “Superhero Training Academy,” where parts of speech are powers to master.
- Science: Present the water cycle as a “River’s Epic Journey,” following a droplet’s adventures.
- Social Studies: Depict historical events as a “Time Traveler’s Log,” with students adding key moments.
Classroom Tip: Start with a quick discussion or “story starter” prompt, like, “If this math concept were a movie, what would it be about?” Let students’ ideas shape the theme, ensuring they’re invested from the start.
Step 2: Involve Students as Storytellers
The power of a story-driven anchor chart lies in its collaborative nature. When students contribute, they take ownership of the learning process. Try these strategies:
- Brainstorming Circle: Gather students to suggest characters, settings, or key terms for the chart. For example, in a science chart about ecosystems, students might propose animals or plants to feature.
- Interactive Contributions: Use sticky notes, index cards, or cutouts for students to add examples, definitions, or illustrations. This keeps the chart dynamic and student-centered.
- Story Roles: Assign roles like “illustrator,” “scribe,” or “narrator” to give every student a part in the chart’s creation.
Example: For a literature unit on theme, create a “Theme Detectives” chart. Students act as detectives, adding clues (quotes or events from a book) to a giant magnifying glass graphic. Each contribution builds the story of the book’s deeper meaning.
Step 3: Design for Visual and Emotional Impact
A story-driven chart should look like a page from a storybook—inviting, clear, and immersive. Focus on these design principles:
- Color Palette: Choose 2–3 colors that evoke the story’s mood (e.g., blues and greens for an ocean-themed science chart). Avoid overwhelming with too many colors.
- Legible Text: Use large, sans-serif fonts like Helvetica or Comic Sans for readability, especially for younger students or those with visual impairments.
- Thematic Graphics: Incorporate icons, borders, or characters that tie to the story. For a history chart, use parchment-style backgrounds or quill pen graphics.
- Organized Layout: Divide the chart into clear sections (e.g., “Problem,” “Solution,” “Examples”) to guide the narrative flow.
Classroom Tip: Sketch a rough draft on paper or a whiteboard to plan the layout. Involve students in deciding where elements go to reinforce their role as co-creators.
Step 4: Build Inclusivity into the Story
Every student should see themselves in the chart’s narrative. Make your anchor chart accessible and welcoming with these strategies:
- Multilingual Elements: Include key terms in languages spoken by your students. For example, a math chart might label “addition” in Spanish (“suma”) or Arabic (“إضافة”).
- Visual Cues: Use images, symbols, or diagrams to support visual learners and those with language barriers.
- Tactile Features: Add textured elements like foam shapes or raised lines for students with visual or sensory needs.
- Simplified Language: Break complex ideas into short, clear phrases to support struggling readers.
Example: For a “Word Wizard” vocabulary chart, create a magical castle where each “room” holds a new word. Include pictures, translations, and textured word cards to ensure all students can explore the castle’s story.
Step 5: Add Interactive and Dynamic Elements
To keep the story alive, make your chart interactive and adaptable. Consider these ideas:
- Flaps and Pockets: Use flaps to hide answers or pockets to store student contributions, encouraging hands-on engagement.
- QR Codes: Link to videos, audio recordings, or student-created content. For example, a history chart could link to a student-narrated timeline.
- Rotating Content: Design charts with removable pieces (e.g., Velcro or magnetic elements) so students can update the story as they learn.
- Digital Companions: Create a digital version using tools like Google Slides or Canva, allowing absent students to access the chart or families to view it at home.
Example: For a science chart on the solar system, create a “Galactic Mission” board. Students move Velcro planets to show orbits, and a QR code links to a class-made video explaining planetary facts.
Step 6: Display, Revisit, and Reflect
A story-driven anchor chart is only effective if it’s actively used. Maximize its impact with these strategies:
- Strategic Placement: Hang the chart at student eye level in a central location, like near the whiteboard or group work area.
- Regular Interaction: Refer to the chart during lessons, asking students to add to or explain parts of the story.
- Reflection Prompts: Encourage students to reflect on the chart’s story. Ask questions like, “How did our ‘Math Mission’ chart help you solve today’s problem?” or “What new chapter should we add to our ‘Story Safari’?”
- Ongoing Updates: As the unit progresses, add new elements to keep the story evolving. For example, a fractions chart might gain new “treasures” as students master more complex problems.
Classroom Tip: Create a “Chart Gallery Walk” where students visit each other’s anchor charts, sharing what they learned from the stories. This builds community and reinforces learning.
Creative Examples of Story-Driven Anchor Charts
Here are five detailed examples to inspire your classroom, each tailored to a different subject and grade level:
- “Math Mission: Fraction Island” (Grade 3–5, Math)
- Story: Students are explorers stranded on Fraction Island, dividing resources (like food or supplies) to survive.
- Chart Features: A map with sticky-note “resources” labeled as fractions (e.g., “½ of the coconuts”). A key explains operations like adding or comparing fractions.
- Interactive Element: Students move pieces to solve problems, such as combining fractions to “feed the crew.”
- Inclusivity: Includes visuals (e.g., pizza slices) and multilingual fraction terms.
- “Story Safari: Plot Structure” (Grade 4–6, Language Arts)
- Story: A jungle adventure where animals encounter plot points (exposition, rising action, climax, resolution).
- Chart Features: A trail map with flaps revealing definitions and student-added examples from a class novel. Each flap is decorated with animal tracks.
- Interactive Element: A QR code links to a class Padlet where students post their own story ideas.
- Inclusivity: Simplified definitions and images support ELLs and visual learners.
- “Ecosystem Expedition” (Grade 5–7, Science)
- Story: A trek through a forest where students map food chains and energy flow.
- Chart Features: A tree diagram with Velcro animals students rearrange to show predator-prey relationships. A “field guide” section lists key terms.
- Interactive Element: Tactile leaves and multilingual labels ensure accessibility.
- Inclusivity: Raised textures and audio QR codes support diverse learners.
- “Time Traveler’s Log” (Grade 6–8, Social Studies)
- Story: Students are time travelers documenting the American Revolution.
- Chart Features: A parchment-style timeline where students add key events on index cards, like “Boston Tea Party” or “Declaration of Independence.”
- Interactive Element: A pocket for students to store “artifacts” (e.g., drawings of historical figures).
- Inclusivity: Includes primary source images and translated key terms.
- “Poetry Portal” (Grade 7–9, Language Arts)
- Story: A magical portal where students explore poetic devices like metaphor, alliteration, and rhyme.
- Chart Features: A glowing portal graphic with sticky notes for student-written examples of each device. A “poet’s toolbox” lists definitions.
- Interactive Element: Students add their own poems to the chart, creating a class anthology.
- Inclusivity: Visual icons and audio recordings of poems support diverse learners.
Troubleshooting Common Challenges
Even the best anchor charts can hit snags. Here’s how to address common issues:
- Limited Space: If wall space is tight, create smaller charts on easels or use digital versions projected during lessons.
- Time Constraints: Build the chart gradually over several lessons, adding elements as students learn.
- Disengaged Students: Increase buy-in by letting students choose the story theme or contribute personal examples.
- Overwhelming Content: Simplify by focusing on one key concept per chart and using clear, concise text.
- Fading Interest: Keep charts fresh by rotating content or connecting them to new lessons.
Classroom Tip: If a chart feels outdated, host a “story refresh” session where students suggest updates or create a sequel chart to continue the narrative.
To make your story-driven anchor charts a reality, use these resources:
- Free Template: Download our Story-Driven Anchor Chart Planner to map out your narrative, design, and interactive elements. (Link placeholder—host on your site.)
- Digital Tools: Use Canva, Google Slides, or Jamboard to create editable digital charts. Share with students or families via a class website.
- Printable Graphics: Access free story-themed icons (e.g., pirates, astronauts, explorers) here to decorate your charts.
- Supply List: Stock up on chart paper, markers, sticky notes, Velcro, and textured materials (e.g., felt, foam) for tactile elements.
- Video Tutorial: Watch our 10-minute guide on designing story-driven charts here.
Budget Tip: Reuse materials like laminated chart paper or magnetic boards to save costs while keeping charts dynamic.
Reflective Prompts for Teachers and Students
Reflection deepens the impact of anchor charts. Use these prompts to spark discussion:
- For Students: “How does the story on our chart help you remember the lesson? What would you add to make it even better?”
- For Teachers: “Which parts of the chart most engaged my students? How can I adapt this story for the next unit?”
- For Class Discussion: “If we turned this chart into a movie, who would the main characters be? What would happen next?”
These prompts encourage students to connect with the chart’s narrative and help you assess its effectiveness.
Beyond the Chart: Building a Storytelling Classroom Culture
Story-driven anchor charts are just the beginning. To create a truly immersive classroom, weave storytelling into other areas:
- Classroom Decor: Design bulletin boards as extensions of your charts’ stories (e.g., a “Math Mission” board with student work).
- Lesson Plans: Frame entire units as stories, with anchor charts as key chapters.
- Student Projects: Encourage students to create their own mini anchor charts, telling personal stories about what they’ve learned.
- Community Building: Use charts to document class goals or values, like a “Class Adventure Map” tracking achievements.
Example: Create a year-long “Class Quest” chart where students add milestones (e.g., “Mastered Multiplication” or “Finished First Novel”) to a shared story of growth.
Conclusion: Write Your Classroom’s Next Chapter
Story-driven anchor charts transform lessons into adventures, making learning a collaborative, inclusive, and unforgettable journey. By crafting narratives, involving students, and designing dynamic visuals, you’ll create charts that don’t just teach—they inspire. Whether you’re guiding explorers through Fraction Island or time travelers through history, your anchor charts will become the heartbeat of your classroom’s story. Start small with one chart, involve your students, and watch their engagement soar. What story will your classroom tell next?
Call to Action: Try creating one story-driven anchor chart this week. Share your experience or a photo of your chart with colleagues or on social platforms with #StoryDrivenCharts. Let’s build a community of storytelling educators!