
DISCOUNTED EDUCATION PRICING! CALL 1-877-891-8411. We Gladly Accept School Purchase Orders!

Why do students remember a picture more than a paragraph? Because the human brain processes visuals 60,000 times faster than text. In a world of constant information, visuals don’t just help—they transform the way we teach.
If you’re a teacher, administrator, or curriculum designer wondering how to supercharge learning outcomes, look no further. Visual teaching strategies are one of the most powerful and underutilized tools in the classroom. In this guide, we’ll explore why visuals matter, how to use them effectively, and what strategies work best for every age group.
Visual teaching strategies are instructional methods that use visual aids—like charts, diagrams, posters, anchor charts, infographics, timelines, mind maps, and videos—to enhance student comprehension and retention.
These strategies aren’t just about decorating a classroom—they’re about creating learning environments where abstract ideas become concrete, complex ideas become understandable, and student engagement soars.
Cognitive research shows that students remember:
Visuals tap into the brain’s spatial memory, making it easier to store and recall information. That’s why a well-designed poster or diagram can reinforce an entire week of instruction.
Every classroom includes a mix of auditory, visual, and kinesthetic learners. Visuals help:
Visuals serve as a universal language. A chart explaining fractions with pizza slices or a timeline showing the Civil Rights Movement transcends reading levels and cultural barriers.
Students are more likely to pay attention and stay on task when lessons are broken up by engaging visuals. Bright colors, illustrations, and interactive displays turn passive learning into active exploration.
Anchor charts display key concepts, strategies, or procedures in a way that stays visible throughout a unit or lesson. They’re perfect for reinforcing:
Pro Tip: Make them interactive! Have students contribute examples or sticky notes.
From Venn diagrams to cause-and-effect chains, graphic organizers help students:
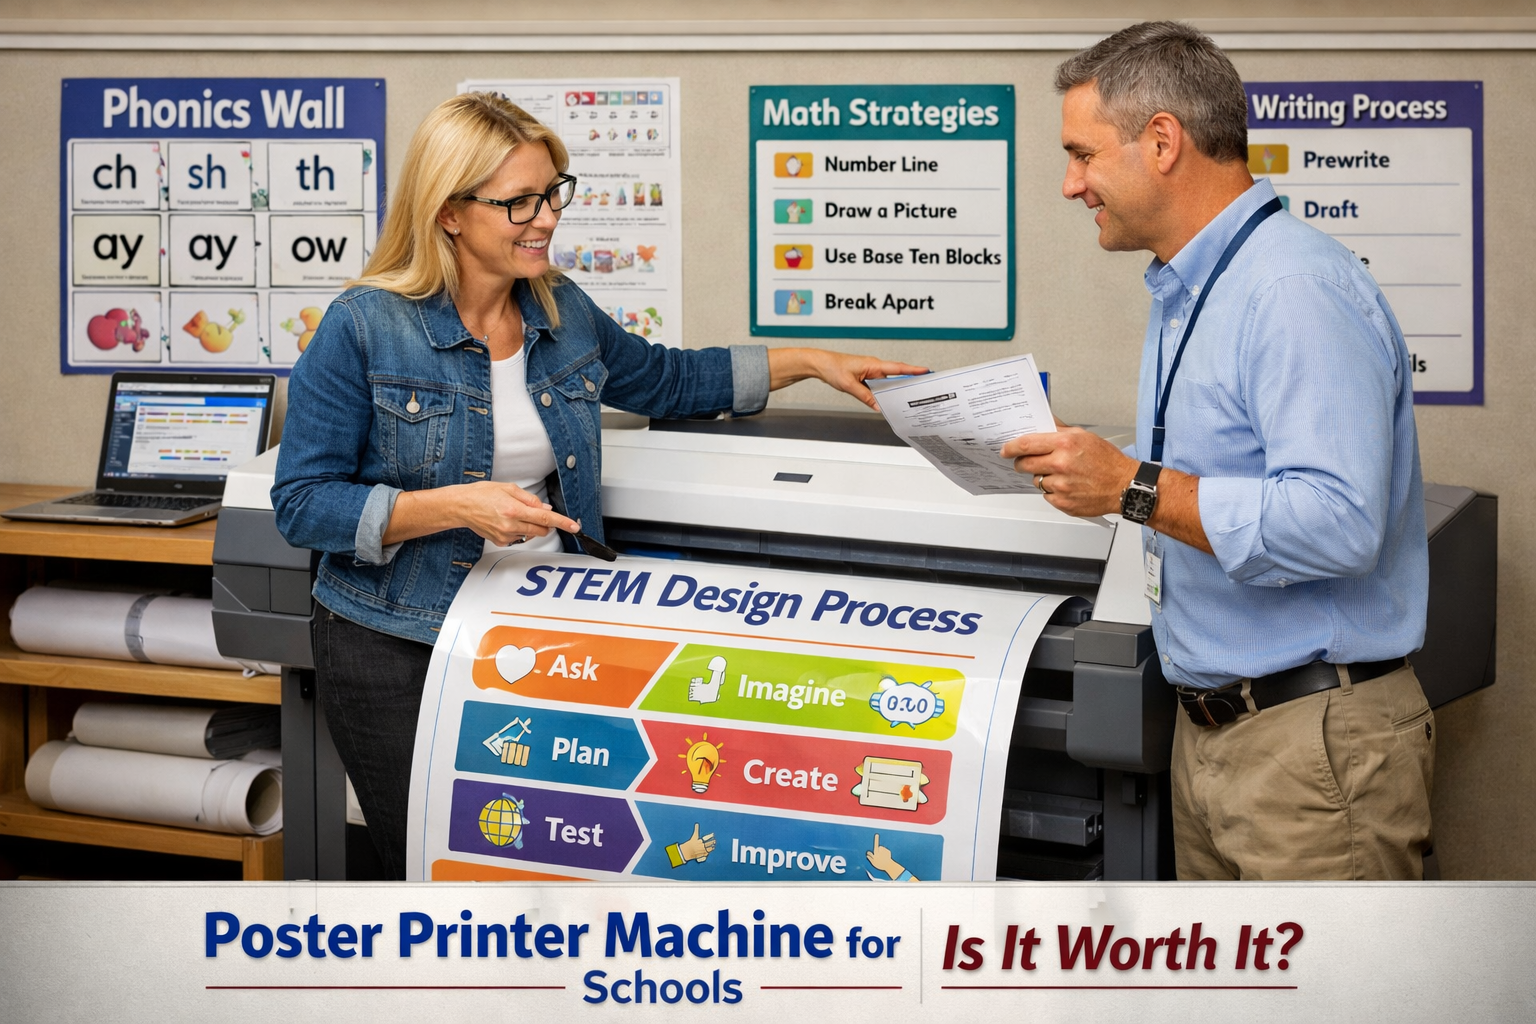
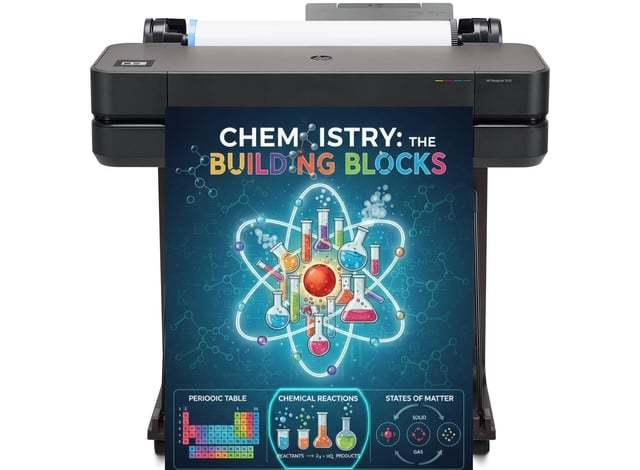
A visually striking poster can turn a hallway or classroom wall into a learning hub. Use them for:
Consider using wide-format poster printers to create professional-quality visuals that last all year.
These spider-like diagrams are excellent for brainstorming, showing relationships, and planning projects. Bonus: They stimulate both sides of the brain.
Smartboards and digital slides combine visuals with interactivity. You can add:
Short explainer videos break down complex ideas into digestible chunks. Create your own or pull from trusted platforms like Khan Academy, Crash Course, or BrainPOP.
Pairing words with pictures accelerates vocabulary acquisition—especially for younger learners or EL students.
Bar graphs, pie charts, and pictograms help students understand math, economics, science, and social studies concepts through data.
Dedicate wall space to evolving units, like a “living” U.S. map during geography month or a butterfly life cycle display in science.
Let students add to or manipulate the visuals on display. For example:
Many teachers unknowingly rely too heavily on verbal instruction or worksheets. Ask:
If not, it’s time to rethink your instructional design.
All of them. Kindergartners need visuals to decode letters. Middle schoolers benefit from graphic organizers. High schoolers grasp complex ideas faster with concept maps and diagrams.
Not at all. While visuals are especially helpful for neurodivergent learners and English Learners, every student gains from a multisensory approach.
You don’t need fancy tools! Start with:
When you walk into a classroom rich with visuals, you feel it: energy, engagement, and understanding are all elevated.
When used with intention, visual teaching strategies transform classrooms into dynamic, brain-friendly learning environments. They reduce barriers, boost comprehension, and support every learner.
So the next time you’re planning a lesson, don’t just ask: “What do I want to say?”
Ask: “What do I want them to see?”