
DISCOUNTED EDUCATION PRICING! CALL 1-877-891-8411. We Gladly Accept School Purchase Orders!
Anchor charts are a staple in modern classrooms, serving as powerful visual tools that enhance student learning, promote engagement, and foster independence. These colorful, teacher-created displays capture key concepts, strategies, and information in a way that’s accessible and memorable for students. Whether you’re a seasoned educator or a new teacher, mastering the art of anchor charts can transform your classroom environment. In this comprehensive guide, we’ll explore what anchor charts are, why they’re effective, how to create them, and how to use them to maximize their impact. Let’s dive in with answers to common questions and actionable tips to make your anchor charts the best they can be!
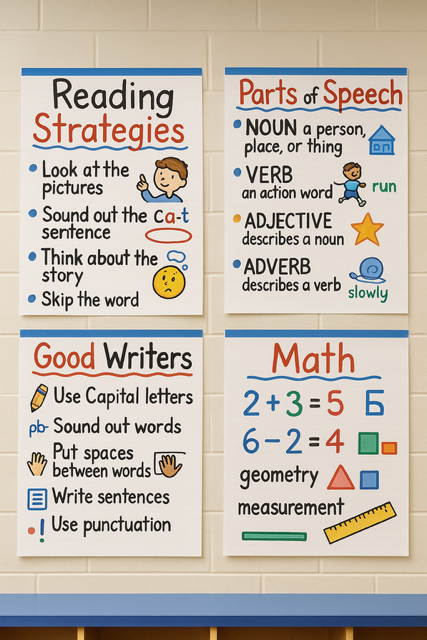
Anchor charts are visual representations of key information, concepts, or strategies displayed in the classroom to support student learning. They “anchor” students’ understanding by providing a reference point for critical content, whether it’s a math strategy, a reading comprehension skill, or classroom expectations. These charts are typically co-created with students during lessons, making them interactive and relevant.
Why are anchor charts important?
They serve multiple purposes:
According to Edutopia, anchor charts are particularly effective because they make abstract concepts concrete, helping students internalize complex ideas through visuals and concise text.
Anchor charts are more than just decorations—they’re instructional tools that bridge the gap between teaching and independent practice. Here’s how they enhance learning:
Question: Can anchor charts be used across all subjects?
Absolutely! Anchor charts are versatile and can be adapted for any subject or grade level. For example:
Creating an anchor chart that’s both functional and engaging requires planning and intentionality. Here’s a step-by-step guide to crafting anchor charts that stand out:
Before you start, identify the chart’s purpose. Ask yourself:
Tip: Focus on one key idea per chart to avoid overwhelming students. For example, instead of a single chart covering all reading strategies, create separate charts for predicting, questioning, and summarizing.
Co-create anchor charts with your students during a lesson. This builds ownership and ensures the chart reflects their language and understanding. For instance, when teaching main idea, ask students to suggest examples from a text you’re reading together.
Invest in durable chart paper, vibrant markers, and sticky notes for interactive elements. Laminating frequently used charts can extend their lifespan.
Hang anchor charts where students can easily see and access them. Consider rotating charts based on the unit or topic to keep the classroom fresh and relevant.
Question: Should anchor charts be perfect and polished?
Not necessarily! While neatness matters for readability, overly polished charts can feel intimidating. Handwritten charts with student input often feel more authentic and relatable. However, if you’re creating a reusable chart, consider using digital tools like Canva to design a polished version.
To keep students engaged, think outside the box with your anchor chart designs. Here are some innovative ideas for different subjects and purposes:
Question: How can I make anchor charts interactive?
Add elements like sticky notes, flaps, or pockets where students can contribute ideas or examples. For instance, during a vocabulary lesson, students can add new words to a pocket chart. Interactive charts keep students engaged and make the charts dynamic.
Anchor charts are particularly effective for supporting diverse learners, including English language learners (ELLs), students with special needs, and visual learners. Here’s how:
Pro Tip: For ELLs, pair words with images or translations in their native language. For example, a math anchor chart might include Spanish translations for key terms like “suma” (addition) or “resta” (subtraction).
With so many anchor charts, classroom space can quickly become cluttered. Here are strategies to keep them organized:
Question: What do I do with old anchor charts?
Repurpose them! Cut out key sections to create flashcards, use them as review materials, or send them home with students as study guides. Alternatively, donate them to new teachers or recycle the paper.
Incorporating technology can take anchor charts to the next level:
Question: Are digital anchor charts as effective as physical ones?
Digital charts are great for remote learning or sharing with absent students, but physical charts have a tactile, classroom-based advantage. They’re always visible, fostering a sense of community and accessibility. Use both depending on your classroom needs!
While anchor charts are powerful, common pitfalls can reduce their effectiveness:
Anchor charts are more than just classroom decorations—they’re dynamic tools that empower students, enhance learning, and foster independence. By planning purposefully, involving students, and keeping charts clear and engaging, you can create a classroom environment where every learner thrives. Whether you’re teaching math, reading, or classroom expectations, anchor charts are your go-to resource for making learning visible and memorable.
Ready to get started? Grab some chart paper, markers, and your students’ ideas, and create anchor charts that transform your classroom. Share your creations online to inspire other educators and watch your classroom’s learning culture soar!
Call to Action: What’s your favorite anchor chart idea? Share it in the comments below or post a photo on social media with #ClassroomAnchorCharts to join the conversation!