
DISCOUNTED EDUCATION PRICING! CALL 1-877-891-8411. We Gladly Accept School Purchase Orders!

In schools all over the US, traditional teaching methods are evolving. One of the most impactful tools that educators are increasingly incorporating into their classrooms is infographics. But why is this visual approach so effective in education, and how can it revolutionize the way students learn? Let’s dive into why infographics in the classroom are a game-changer.
Infographics are visual representations of information, data, or knowledge that make complex information easier to understand. By combining graphics, charts, icons, and text, they create an intuitive, digestible format that can simplify the learning process.
1. Simplification of Complex Information
Infographics break down complex topics into clear, easy-to-understand chunks. Imagine trying to explain a complicated scientific theory or a historical event. With infographics, educators can create timelines, step-by-step guides, or data visualizations that make the material more accessible.
2. Visual Learning Enhances Retention
Studies show that visual learners tend to retain information better when it’s presented in a visual format. Infographics provide a way to engage these students by offering a blend of text and images, catering to their preferred learning styles.
3. Increased Engagement
In the classroom, engagement is key to learning. Infographics are eye-catching and fun, making lessons more interactive and enjoyable. Students are more likely to stay focused and interested when presented with engaging visuals rather than dense blocks of text.
4. Foster Critical Thinking
When students analyze infographics, they have to assess the data, understand its context, and interpret the relationships between various elements. This process encourages critical thinking and improves their analytical skills.
1. Summarizing Key Concepts
Teachers can create infographics that summarize key points from a lesson. This could include a recap of a lecture, a visual of a historical event, or an overview of scientific processes.
Example:
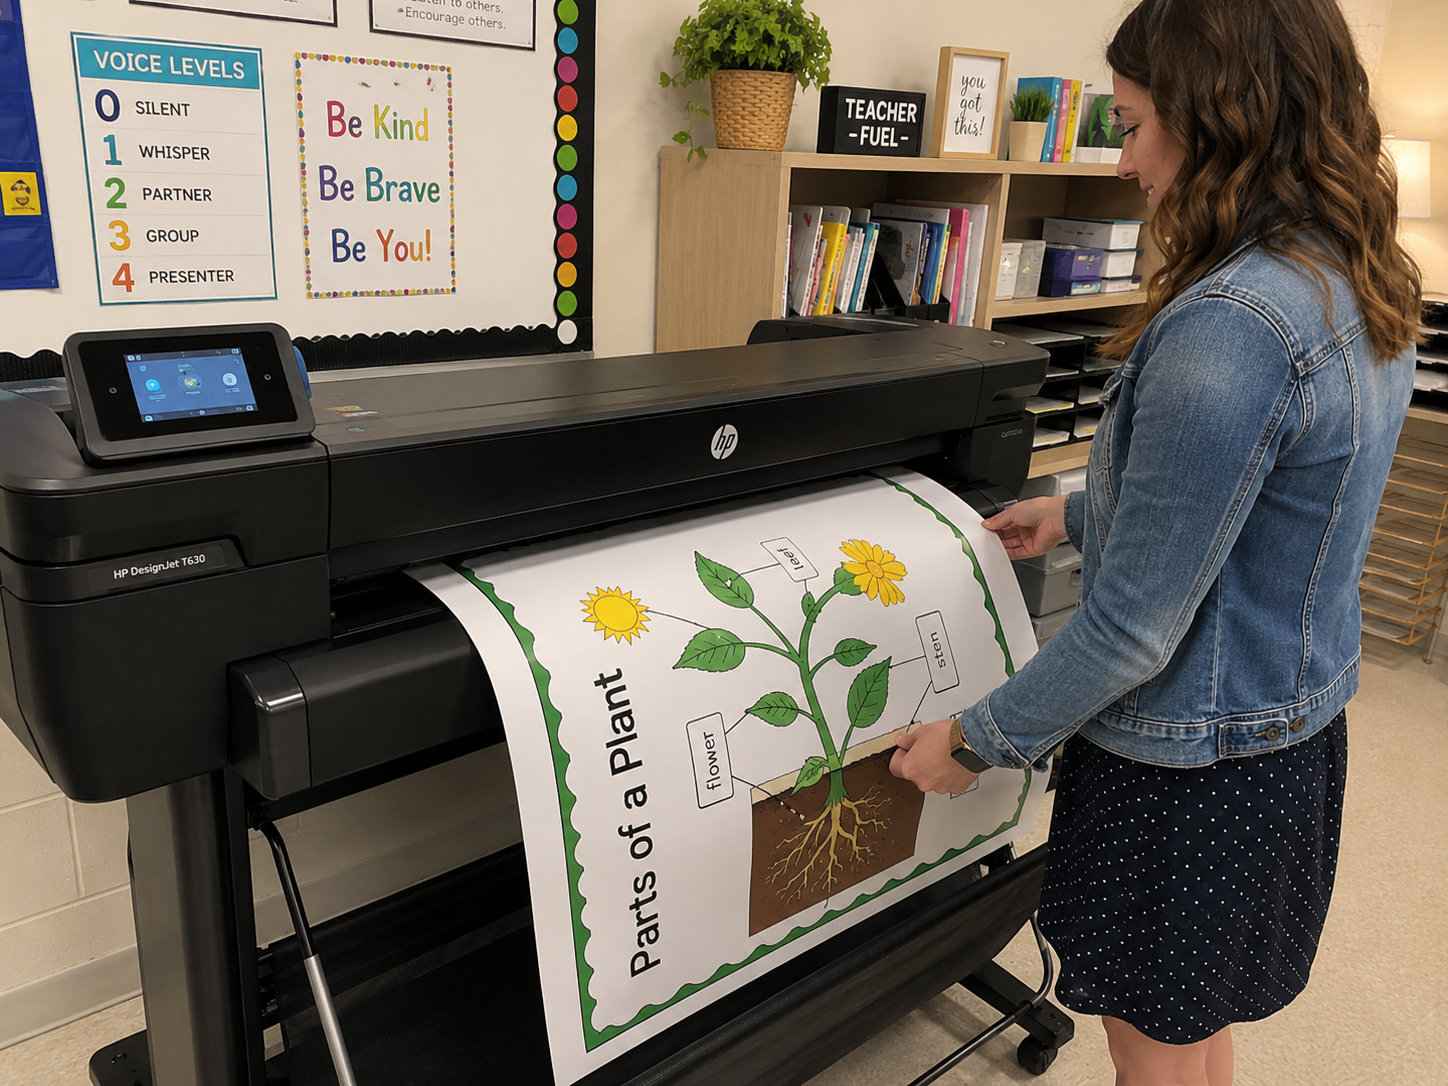
In a history class, a teacher could create an infographic that visually represents the causes and effects of World War I. It might include timelines, maps, and key figures to provide a concise, digestible summary of a complex topic.
2. Reinforcing Lessons with Interactive Infographics
Infographics can be interactive! Tools like Google Slides or Canva allow teachers to create clickable infographics where students can explore different aspects of a topic at their own pace.
Example:
In biology, an infographic showing the human circulatory system could have interactive elements where students click on different organs to learn more about each one.
3. Data Visualization for Better Understanding
Infographics are especially useful for teaching data analysis. Teachers can present data in a visual format, making it easier for students to interpret numbers and draw conclusions.
Example:
A math teacher could create an infographic that shows how to solve algebraic equations step-by-step with corresponding charts, diagrams, and equations.
Yes! Infographics can be a powerful tool for collaboration in the classroom. By working together to create or analyze infographics, students can practice teamwork and communication skills while also engaging deeply with the material. Group projects involving infographics can foster creativity and critical thinking.
Example:
In an English literature class, students could work in groups to design an infographic that summarizes a novel, highlighting its key themes, characters, and plot developments.
1. History: Infographics can help explain historical events by presenting timelines, key dates, figures, and causes of events. This visual format simplifies complicated history lessons, making them engaging and easy to understand.
2. Science: In science, infographics can break down complex concepts like the human body’s anatomy or environmental issues. They can present data on climate change or illustrate scientific processes such as photosynthesis, helping students grasp abstract concepts more easily.
3. Math: In subjects like math, infographics can visually demonstrate how to solve equations, graph functions, and explain geometry concepts with clear diagrams. These visual aids are excellent for helping students understand abstract mathematical ideas.
4. Literature: Infographics can help students visualize themes, characters, and plot development in novels, plays, or poems. A well-designed infographic can break down the plot of a story, summarize key events, and offer insight into character relationships.
With the advancement of AI tools and design software, the future of infographics in the classroom looks brighter than ever. Educators can easily create customized, interactive infographics that cater to the specific needs of their students. Additionally, infographics will continue to evolve, becoming more immersive and integrated with technologies like augmented reality (AR) and virtual reality (VR).
| Learning Method | Visual Aid | Engagement | Retention Rate |
|---|---|---|---|
| Infographics | High | High | 65% |
| Text-Based Learning | Low | Low | 30% |
| Interactive Learning | High | Very High | 75% |
| Traditional Lectures | Low | Medium | 50% |
Infographics are more than just pretty pictures; they are powerful tools that can dramatically enhance learning. By simplifying complex concepts, improving student engagement, and encouraging critical thinking, infographics in the classroom can help students thrive. As technology continues to evolve, the potential for infographics to revolutionize education will only grow, making it an essential resource for modern educators.
1. How do I create an infographic for my class? Creating an infographic can be as simple as using tools like Canva, Piktochart, or Google Slides. These platforms provide templates and easy drag-and-drop options for adding text, images, and charts.
2. How can infographics benefit students with learning disabilities? Infographics provide a visual format that can simplify complex information. This visual representation can help students with learning disabilities (such as dyslexia) understand the material better and stay engaged.
3. Are there any challenges to using infographics in the classroom? While infographics can be highly effective, it’s essential that they are well-designed. Poorly created infographics can overwhelm students instead of helping them. Teachers should ensure that infographics are clear, concise, and relevant to the topic.