DISCOUNTED EDUCATION PRICING! CALL 1-877-891-8411. We Gladly Accept School Purchase Orders!

Are you a teacher searching for anchor chart ideas to transform your classroom into an engaging learning hub? Whether you’re looking for anchor charts for reading, anchor charts for math, or interactive anchor charts that get students involved, you’ve landed in the right place. Anchor charts are more than just posters—they’re dynamic tools that “anchor” key concepts in students’ minds, making abstract ideas concrete and accessible. In this comprehensive guide, we’ll dive deep into everything you need to know about anchor charts, from beginner basics to advanced tips. By the end, you’ll have a treasure trove of anchor chart examples, templates, and strategies to elevate your teaching game and help your students thrive.
As educators, we know the struggle: How do you make lessons stick? Teachers often search for classroom anchor charts that are visually appealing, easy to create, and effective for all grade levels—from anchor charts kindergarten to high school. Let’s explore why these tools are a staple in modern classrooms and how you can master them.
At their core, anchor charts are large, visual displays created collaboratively by teachers and students to capture essential information from a lesson. Think of them as the “anchors” that hold ideas steady amid the sea of daily learning. Unlike pre-made posters, anchor charts are often built in real-time during class, incorporating student input to make them more meaningful.
For instance, a simple definition: An anchor chart might feature bold headings, bullet points, diagrams, or examples that summarize a concept like main idea in reading or place value in math. They’re versatile for any subject and adaptable for digital or physical formats.
Teachers frequently ask, “What are anchor charts?” They’re not just decorations; they’re instructional scaffolding that supports independent learning. In elementary classrooms, they might use colorful illustrations, while in middle school, they could include more complex diagrams or student-generated examples.
Why bother with anchor charts for teachers? The advantages are backed by educational best practices and teacher experiences shared across platforms like Pinterest and X (formerly Twitter).
Research and teacher testimonials highlight these perks. On X, educators rave about how anchor charts improve reading responses by providing visible categories and examples. Plus, they’re cost-effective—most require just chart paper, markers, and creativity.
Creating how to make anchor charts doesn’t have to be overwhelming. Follow these step-by-step tips for standout results:
Tools you’ll need: Chart paper, markers (thick for visibility), sticky notes, and templates from sites like Storyboard That or Teachers Pay Teachers. Pro tip: Use anchor chart hacks like tracing templates for quick setup.
Teachers search endlessly for anchor chart ideas tailored to subjects. Here are curated suggestions, with examples from real classrooms.
For anchor charts kindergarten, keep them picture-heavy; for older grades, add depth.
Take it up a notch with interactive anchor charts. Add flaps, pockets, or sticky notes for hands-on engagement. Teachers love turning spelling into “thinking subjects” with mini toolboxes.
Digital anchor charts are perfect for hybrid learning. Use tools like Google Jamboard or Canva to create shareable versions. One viral tip: Mini laminated photos of charts for student binders in small classrooms.
Need inspiration? Check these anchor chart examples:
| Subject | Template Idea | Example Source |
|---|---|---|
| Reading | Main Idea Pizza | We Are Teachers |
| Math | Place Value Grid | TPT |
| Writing | Process Flowchart |
Anchor charts are a game-changer for any classroom, offering endless anchor chart ideas for teachers across all grades and subjects. From anchor charts for elementary school basics like nouns anchor charts, verbs anchor charts, and adjective adverb anchor charts, to more advanced options such as prefixes suffixes roots anchor charts, theme and evidence anchor charts, or even glossary anchor charts, these versatile tools cater to every educational need. Whether you’re exploring anchor charts for reading comprehension, anchor charts for math key words, anchor charts for writing process, or anchor charts for science like the scientific method, incorporating them will significantly boost student engagement, retention, and independence.
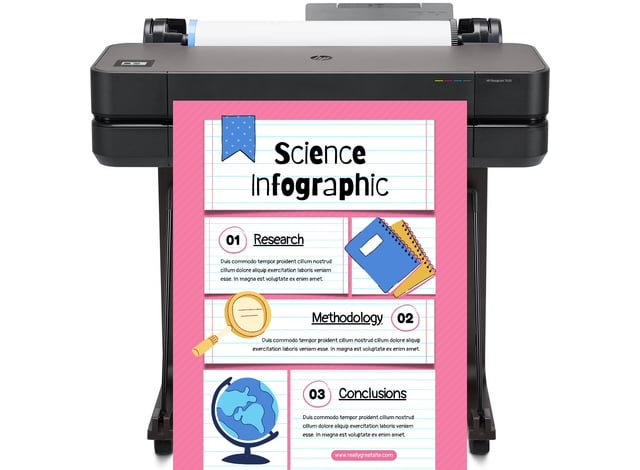
As you integrate these resources, remember that anchor charts aren’t just visual aids—they’re co-created references that empower students to take ownership of their learning. Start small by grabbing a printable anchor chart template, involve your students in the creation process, and watch the magic happen as concepts come to life. Teachers everywhere are discovering the power of interactive anchor charts for phonics, blends, or even evidence-based terms anchor charts to make lessons more memorable and effective. Learn more about how to print anchor charts in our blog.
If you’re new to this, don’t hesitate to experiment with digital anchor charts for hybrid settings or mini anchor charts for individual desks. The possibilities are truly endless, from classroom anchor charts that set expectations to specialized ones like anchor charts for addition subtraction strategies or rhetorical appeals. What’s your favorite anchor chart—perhaps a main idea and details anchor chart or a place value anchor chart? Share in the comments below and join the community of educators transforming their teaching!
Ready to dive in? Explore resources on We Are Teachers, Teaching with a Mountain View, or TPT for more anchor chart templates, examples, and inspiration tailored to your specific needs, whether it’s anchor charts kindergarten style or high school biology concepts. Your classroom will thank you, and so will your students!