
DISCOUNTED EDUCATION PRICING! CALL 1-877-891-8411. We Gladly Accept School Purchase Orders!

In today’s hyper-connected, distraction-saturated world, capturing and sustaining student attention has become one of the greatest challenges facing modern educators. Classrooms are no longer just spaces for passive information delivery—they’re dynamic environments where teachers must constantly compete with short attention spans, diverse learning needs, and the ever-present pull of digital media.
Amid this complexity, one of the most effective—and often underutilized—teaching tools is the strategic use of visuals. From charts and diagrams to infographics and videos, visual aids are not simply enhancements to a lesson—they are fundamental to how students process, retain, and engage with information.
But what makes visuals so powerful? Is there real science behind their impact? And how can teachers incorporate them in ways that go beyond decoration and truly support deep learning?
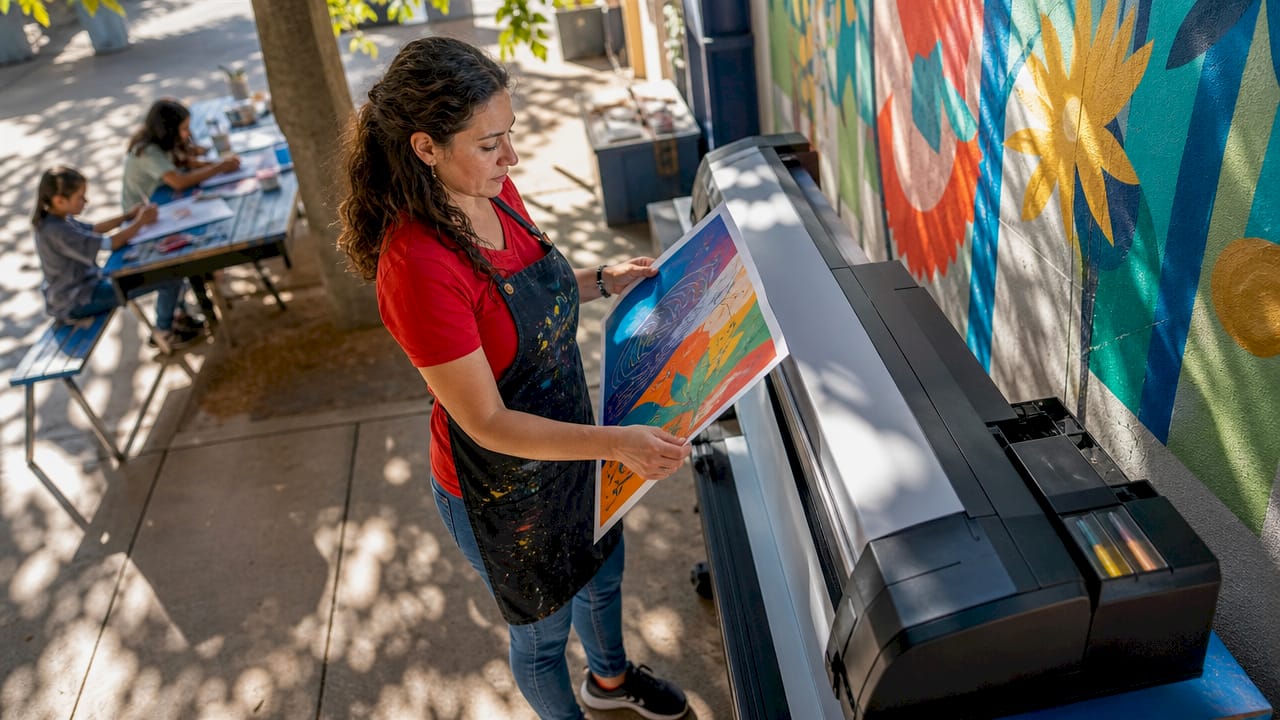
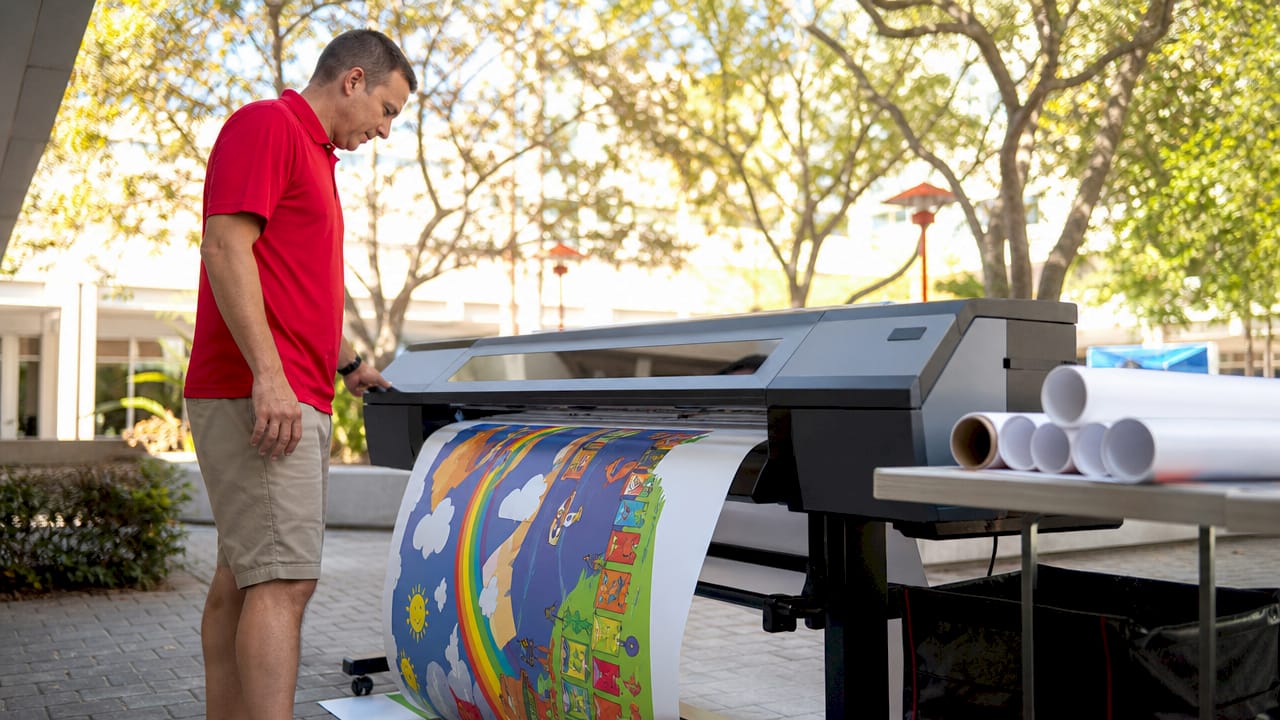
This blog dives into the cognitive science behind visual learning, unpacks key educational research, and offers practical, classroom-ready strategies for using visuals to supercharge instruction. Whether you’re teaching kindergarteners or college students, the evidence is clear: seeing is not just believing—it’s learning. With the help of a classroom poster maker machine, school visuals are available at your fingertips.
Visual information is processed up to 60,000 times faster than text by the human brain (3M Corporation). This means that when students encounter a diagram, infographic, or image, they can grasp complex ideas far more quickly than through text or verbal explanation alone.
But this isn’t just an interesting statistic—it has profound implications for education. Faster processing leads to deeper comprehension, and when paired with well-designed visuals, it significantly enhances memory retention. In other words, students don’t just understand the material more quickly—they remember it longer and apply it more effectively.
Yes. Studies have consistently shown that students who learn through visual means perform better on tests and retain more information long-term.
The use of visuals in education isn’t based on trend or intuition—it’s grounded in decades of cognitive research. Several landmark theories and studies explain why visuals are so effective in improving student understanding, retention, and academic performance.
Dr. Richard Mayer, a cognitive psychologist and one of the leading researchers in educational psychology, introduced the Cognitive Theory of Multimedia Learning, which remains foundational in instructional design today. Mayer’s theory is built on the idea that humans learn more deeply when information is presented in both words and pictures, rather than through text alone.
He identified three core principles of multimedia learning:
In practice, this means that pairing spoken or written explanations with well-designed visuals helps students better organize and internalize knowledge. It reduces cognitive load and leads to deeper conceptual understanding, particularly in subjects like science, math, and history where abstract ideas often need concrete representation.
Long before Mayer, psychologist Allan Paivio laid the groundwork for understanding how visuals enhance learning through his influential Dual Coding Theory. Paivio proposed that the human brain uses two distinct but interconnected systems for processing information:
When learners engage both systems simultaneously, they create two mental representations of the same concept—verbal and visual. These dual representations reinforce one another, making it easier to recall and apply the information later. In essence, visual aids don’t just complement verbal learning—they amplify it.
This theory has become a cornerstone of instructional strategies that integrate imagery, mind maps, icons, and other non-text elements to support memory and comprehension.
Robert J. Marzano, a respected researcher in K–12 education, took a more applied approach in his study of what actually works in classrooms. His comprehensive meta-analysis, published in Classroom Instruction That Works, found that the use of nonlinguistic representations—such as charts, graphs, concept maps, and physical models—has a substantial impact on student achievement.
According to Marzano, incorporating these visual strategies can yield effect sizes as high as 0.75. To put this in perspective, that’s the equivalent of nearly two full years of academic growth when consistently applied. Visual tools help students organize their thinking, make abstract ideas more concrete, and create mental models that support long-term retention.
Importantly, Marzano emphasized that these strategies are particularly effective when students generate their own visuals—for example, drawing diagrams or building concept maps—because it leads to active engagement and deeper learning.
Together, these theories and findings provide a powerful, research-backed case for why visuals should be central—not supplemental—in modern teaching practices. They shift the role of imagery from “optional enhancement” to essential learning architecture.
Here’s a summary of findings from compiled research:
| Outcome | With Visuals (%) | Without Visuals (%) |
|---|---|---|
| Comprehension | 85 | 60 |
| Retention | 80 | 50 |
| Engagement | 90 | 55 |
The numbers speak for themselves: visual learning significantly outperforms text-only methods.
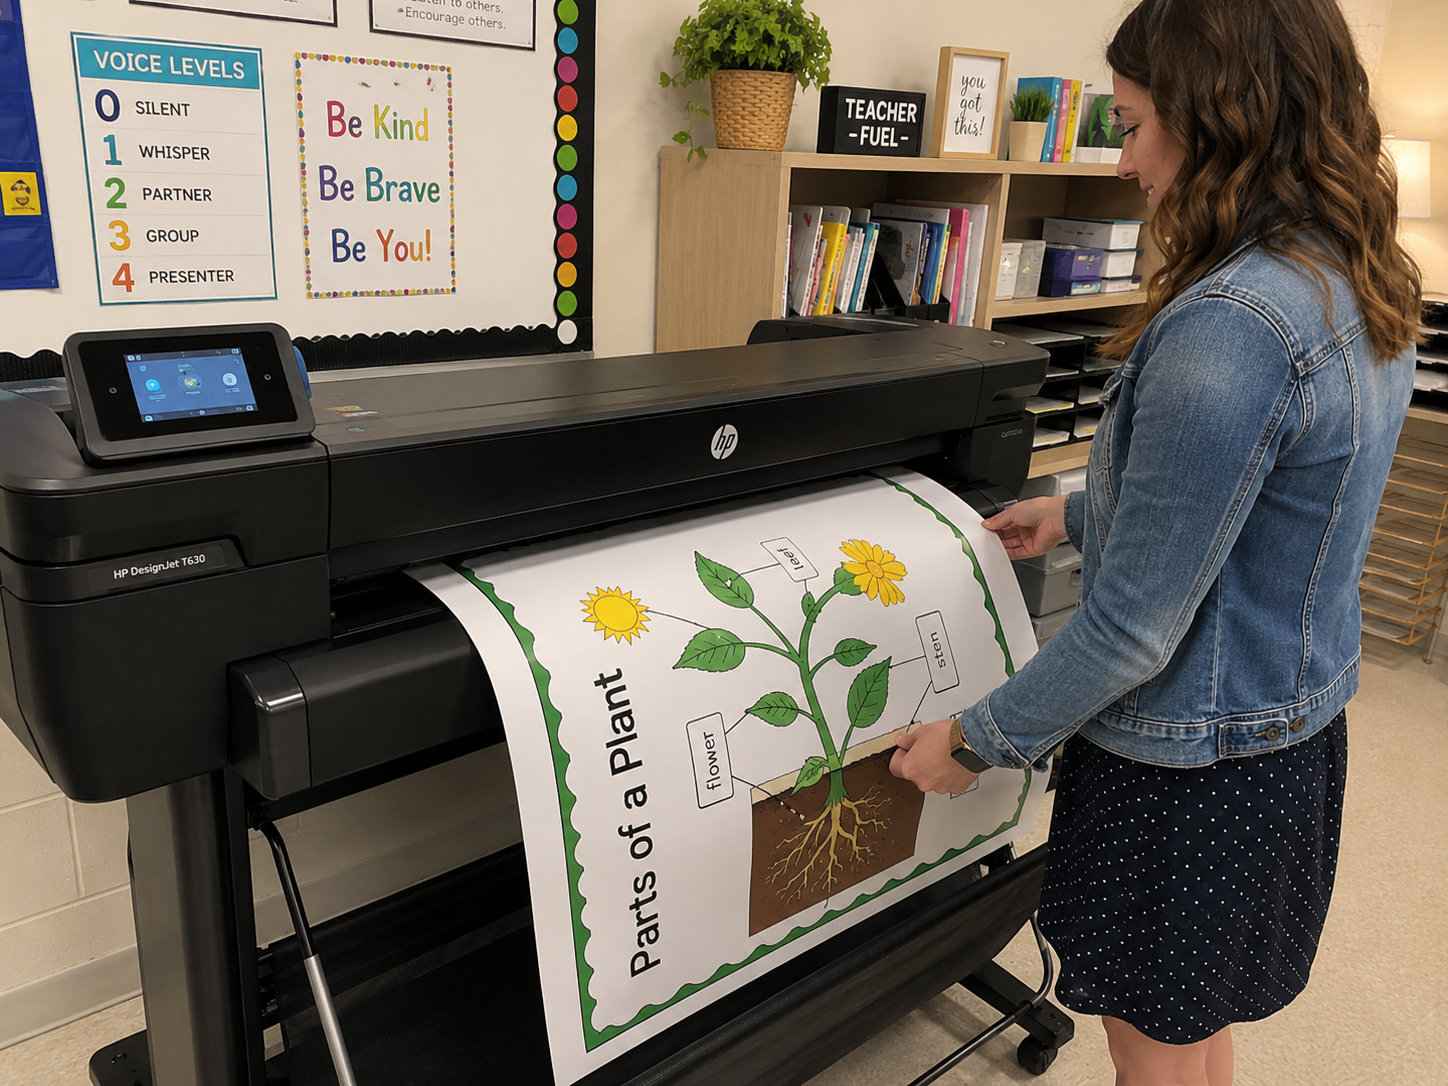
Complex concepts like the water cycle or algebraic formulas are easier to understand when represented visually.
Great for brainstorming, reviewing, or organizing ideas. They help with memory and critical thinking.
Dynamic content grabs attention and helps explain processes that static images can’t.
Use colors to differentiate concepts, highlight key ideas, or categorize topics. It adds a visual anchor to abstract ideas.
A 2022 study conducted in an urban middle school integrated visuals into 8th-grade science classes. After one semester, test scores increased by 23%, and students reported feeling “more confident” and “more interested” in science. Teachers noticed reduced off-task behavior and improved class participation.
Visuals are far more than classroom embellishments—they are strategic instruments of learning. When used with intention, they can transform abstract concepts into concrete understanding, boost memory retention, and elevate student engagement across all levels.
Integrating visuals isn’t about making lessons look better; it’s about making learning stick. The research is clear: when students see it, they get it. For educators aiming to deepen impact and reach diverse learning styles, visual tools aren’t optional—they’re essential.
Embrace visuals not as an add-on, but as a core pillar of effective teaching.