
DISCOUNTED EDUCATION PRICING! CALL 1-877-891-8411. We Gladly Accept School Purchase Orders!

As an educator or school district professional, you are constantly looking for ways to improve the learning experience for students. One of the most effective and engaging tools at your disposal is the infographic—a visual representation of information or data that makes complex concepts more accessible and digestible. In a world where attention spans are shorter and visual communication reigns supreme, infographics have become a game-changer in education.
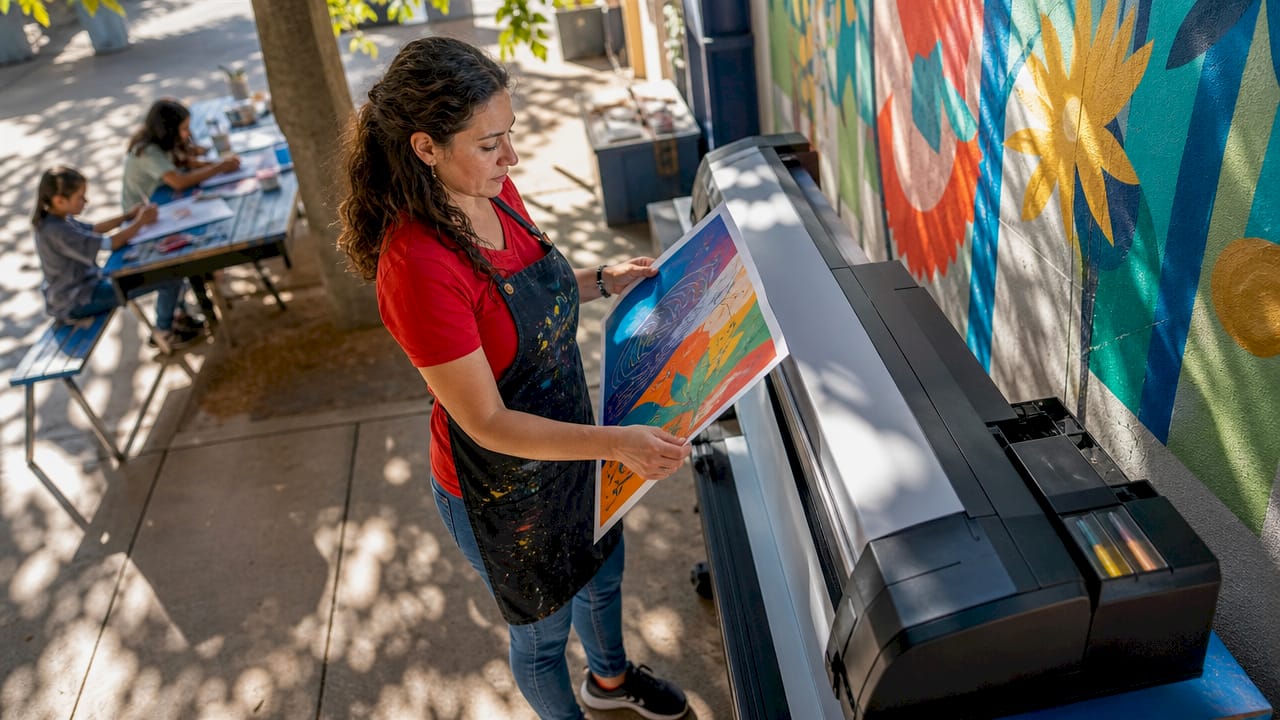
Incorporating poster making machines into your school’s toolkit can empower educators to create high-quality, large-format infographics that boost student engagement and help bring lessons to life. Whether it’s for a classroom display, a science fair project, or a school-wide event, the ability to print infographics on a poster maker gives you the flexibility and creativity needed to communicate essential information effectively.
In this blog, we’ll explore how a school can use a poster making machine to create various types of infographics, and how each type of infographic can be used to enhance the learning experience. We’ll dive into the top 7 types of infographics that every school can benefit from, and how you can leverage these infographics to increase student engagement and improve knowledge retention.
Before we dive into the specific types of infographics, it’s important to understand why poster making machines are such a valuable asset for schools. A poster maker for schools allows you to print large-format materials that are crucial for creating visually engaging and informative graphics. Unlike traditional printers, poster making machines can print on larger media sizes, often up to 36 inches wide, making them ideal for infographics that need to be displayed in a classroom, hallway, or common area.
By utilizing a these amazing printers schools can produce high-quality, professional-grade infographics that make data easier to understand and more enjoyable to engage with. Whether it’s a comparative infographic displaying the results of a science experiment or a geographical infographic showcasing historical maps, the flexibility and capabilities of a poster making machine make it the perfect tool for educational environments.
When it comes to designing infographics, the possibilities are endless. These printers are versatile tools that allows you to bring any idea to life. Here are the top 7 types of infographics that schools can create using a poster making machine to enhance their curriculum and engage students.
Listicle infographics are a popular and engaging way to display information in a list format. These infographics break down information into easily digestible sections, often paired with visuals and icons to make each point stand out. For example, a listicle infographic could be used in an English class to showcase key grammar rules or in a history class to highlight the major events in a historical period.
How schools can use listicle infographics:
With a poster making machine, you can print these infographics in large format, allowing the entire class to easily view and understand the content. The visuals and easy-to-read text enhance retention and make the information more accessible to all students.
Comparative infographics are designed to show the similarities and differences between two or more concepts, processes, or ideas. They are perfect for subjects that require contrasting information, such as comparing different historical events, scientific phenomena, or even geographical features.
How schools can use comparative infographics:
With a poster making machine, these infographics can be printed in large, clear formats, making it easy for students to compare and contrast information side by side. The visual elements in a comparative infographic—like arrows, color-coding, and icons—help students understand complex relationships quickly and effectively.
Charts and statistical infographics are essential when you need to present data in a way that is both visually appealing and easy to understand. These infographics include pie charts, bar graphs, line graphs, and other visual representations of data. For example, a statistics infographic might show the percentage of students who passed a particular exam or represent data on how different countries rank in terms of educational achievement.
How schools can use charts & statistical infographics:
Using a poster making machine, educators can print detailed charts and graphs on large-format paper that can be displayed on classroom walls, helping students to better visualize and understand complex data. This is particularly helpful for visual learners who benefit from seeing data in a concrete form.
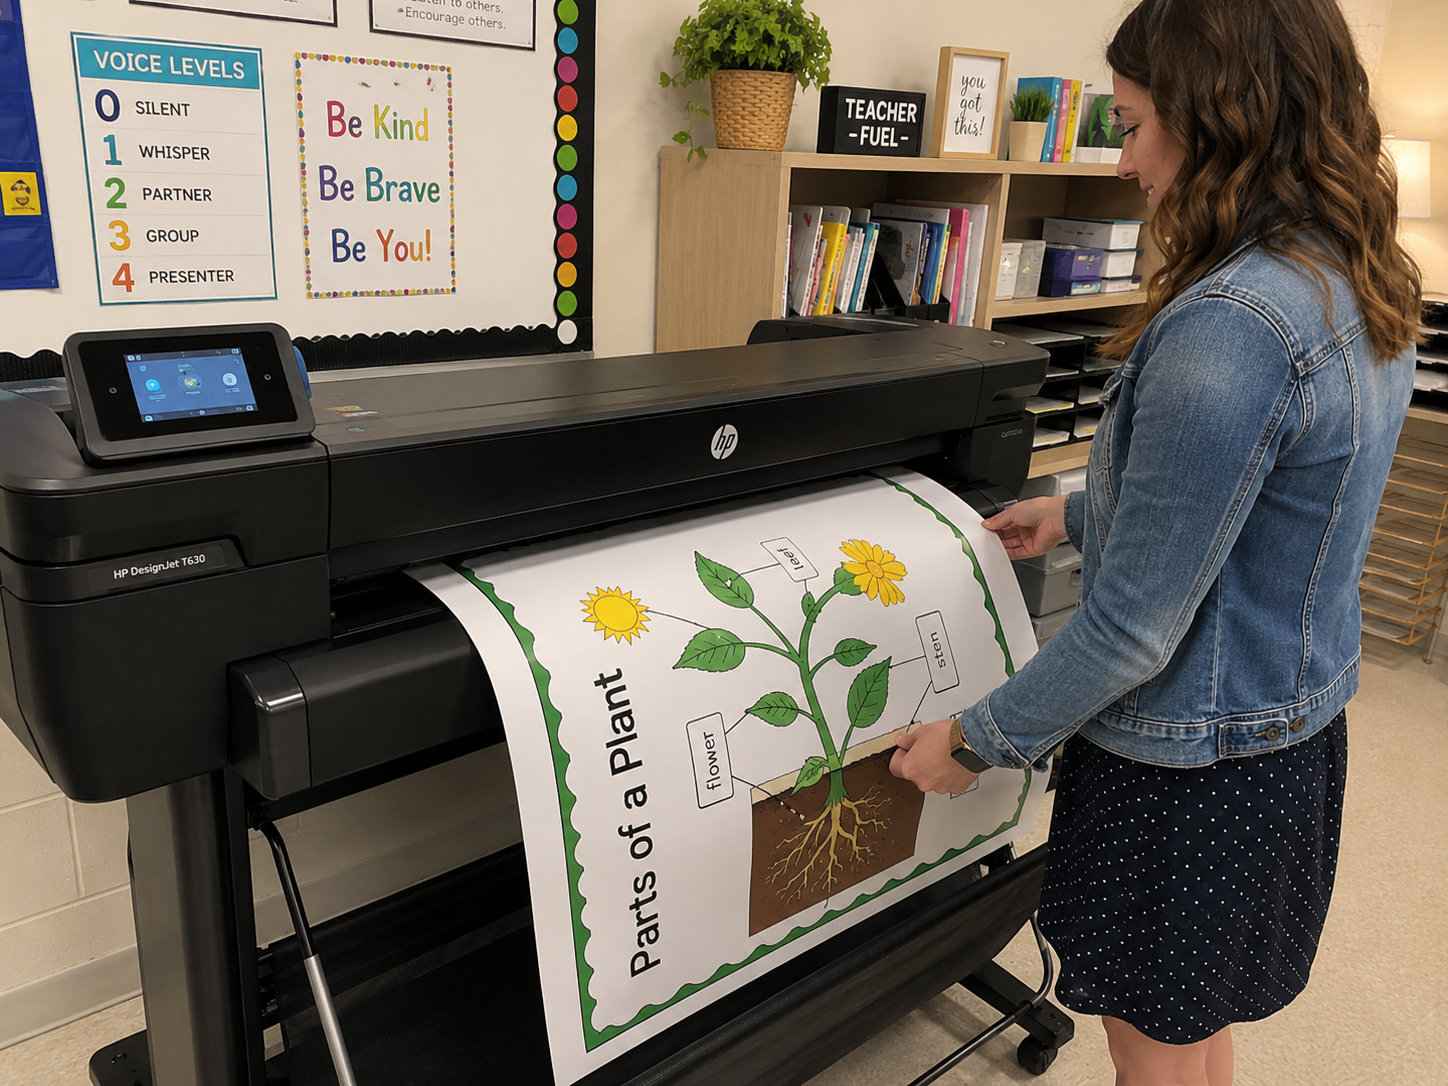
Visual infographics focus heavily on imagery and design to convey information without relying too much on text. These infographics are especially effective in helping students understand concepts at a glance. For example, a visual infographic might illustrate the stages of the water cycle, showing how water evaporates, condenses, and precipitates through engaging visuals.
How schools can use visual infographics:
The poster making machine is ideal for printing visual infographics in large format, allowing students to explore and learn from vibrant, easy-to-understand imagery. By minimizing text and focusing on design, these infographics make learning more accessible for all students, including those with learning disabilities or English language learners.
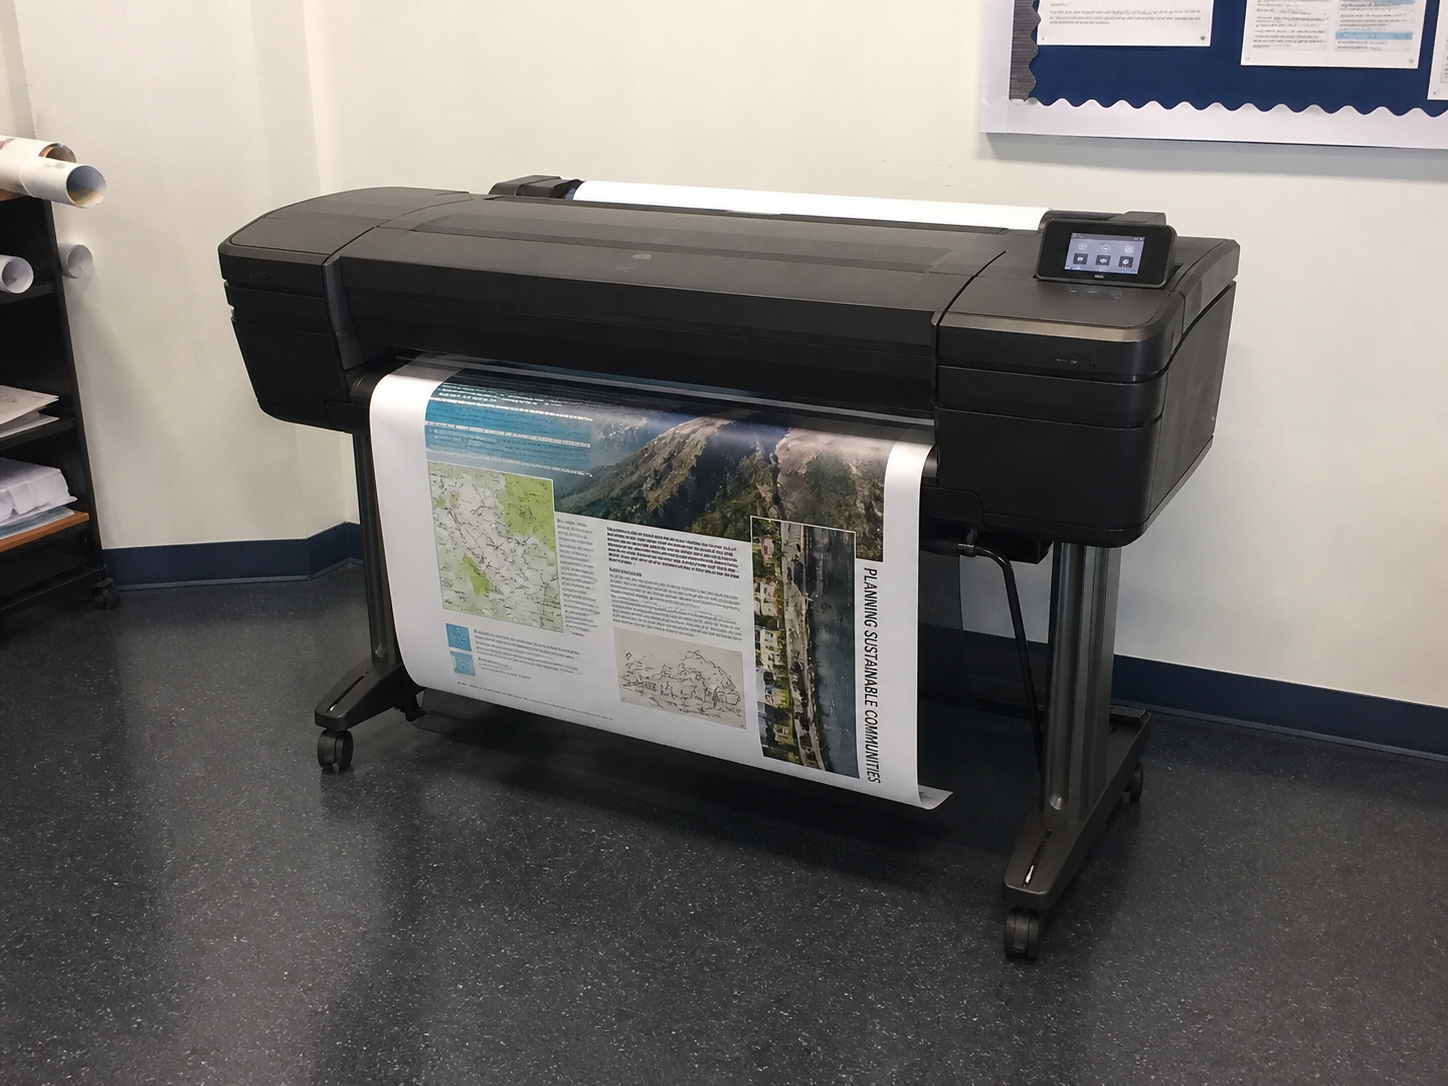
Geographical and map infographics are an essential tool for geography, history, and even environmental science classes. These infographics can include detailed maps, charts, and other visuals that help students understand the physical layout of the world, countries, continents, and other geographical features.
How schools can use geographical & map infographics:
A poster making machine allows you to print detailed, high-quality maps and geographical visuals on large media, making it easier for students to explore and engage with the content. These maps can be hung in classrooms or used as part of interactive displays for student projects.
Timeline infographics are used to showcase events in chronological order. They are perfect for subjects like history, literature, and even project management, as they help students visualize the progression of events over time. For example, a timeline infographic might show the sequence of key events in a historical period or the development of a scientific theory.
How schools can use timeline infographics:
With a poster making machine, timeline infographics can be printed in large formats and displayed prominently in classrooms, making it easy for students to follow along with historical events or narrative structures.
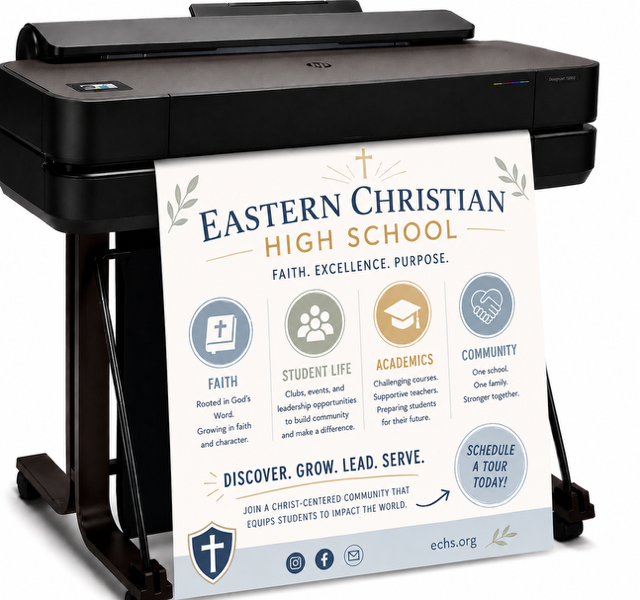
Informational infographics are a broad category that provides key information about a topic in an easy-to-understand format. These infographics typically include text, icons, and visuals to convey the most important facts and figures about a subject. For example, a school safety infographic could provide important tips and procedures for students to follow in case of an emergency.
How schools can use informational infographics:
A poster making machine allows schools to print detailed informational infographics that can be posted in hallways, classrooms, and other common areas, providing quick access to essential information.
Poster making machines are essential tools for schools looking to create high-quality, engaging infographics that enhance the learning experience. From listicle infographics to informational infographics, these machines give educators the ability to bring complex concepts to life in a way that is visually appealing and easy to understand.
By using a poster making machine to print a wide range of infographics, schools can improve student engagement, boost information retention, and foster a deeper understanding of the material. Whether you’re looking to create detailed charts, engaging visual infographics, or informative timeline infographics, a poster maker offers the flexibility, quality, and efficiency that your school needs to succeed.
Invest in the best poster making machine today and watch how it transforms your school’s ability to communicate essential information and support student learning!